St Pauls
Leave a reply
That is Norway’s Sovereign Wealth Fund.
Norway’s sovereign wealth fund gains £140bn in one year – £26,400 for every citizen
Its total value is now equivalent to £160,000 for each of Norway’s 5.3 million people
Norway’s sovereign wealth fund earned a record £140bn, meaning an extra £26,400 for every citizen of the oil-rich nation.
A bumper year saw 19.9 per cent rise in the value of investments held by the fund, taking its total value to more that 10 trillion Norwegian Crowns.
Norway’s fund, set up in 1990 to preserve the nation’s oil and gas wealth for future generations, is the biggest sovereign fund in the world, owning around 1.5 per cent of all shares in listed companies.
The fund helps pay for generous welfare provision and its total value is now equivalent to £160,000 for each of Norway’s 5.3 million people. It hit the 10 trillion-krone landmark in 2019, exactly 50 years since fossil fuels were first discovered beneath Norwegian waters, dramatically altering the nation’s trajectory.
The fund pledged this year to sell its stake in oil and gas exploration firms, although some campaigners say the move does not go far enough. It maintains stakes in Shell, BP and other oil majors.
The Montanaro UK Smaller Companies Investment Trust PLC is a London Listed investment company
http://www.montanaro.co.uk/our-trusts/uk-smaller-companies-investment-trust/overview
The Trust aims to achieve capital appreciation through investing in small quoted companies listed on the London Stock Exchange or traded on the Alternative Investment Market (“AIM”) and to achieve relative outperformance of its benchmark, the Numis Smaller Companies Index (excluding investment companies) (“NSCI”).
Top 10 Holdings:-
Integrafin 4% of the fund
Information Ratio 3.9% of the fund
4Imprint Group 3.6% of the fund
Ideagen 3.3% of the fund
Hilton Food Group 3.2% of the fund
Marshalls 3.6% of the fund
XP Power 3.6% of the fund
Discoverie Group 2.9% of the fund
Porvair 2.8% of the fund
Polypipe Group 2.7% of the fund
Total: 32.9% of the fund.
The largest shareholders are:-
1607 Capital Partners LLC 10.0% of voting rights
Border to Coast Pensions Partnership 8.9% of voting rights
Derbyshire County Council 7.9% of voting rights
Brooks Macdonald Group plc 5.4% of voting rights
Montanaro Asset Management Limited 5.0% of voting rights
Quilter Cheviot Limited 5.0% of voting rights
Newton Investment Management Limited 5.0% of voting rights
Jupiter Asset Management Limited 4.7% of voting rights
Royal London Asset Management Limited 4.0% of voting rights
City of Bradford Metropolitan District Council 3.7% of voting rights

The Intelligent Investors
It’s not the employer who pays the wages. Employers only handle the money. It’s the customer who pays the wages. –Henry Ford
Tomorrow Greencoat UK Wind pays out its dividend.
https://www.greencoat-ukwind.com/
£0.01735 a share.
The total voting rights figure will be 1,517,537,310
https://www.londonstockexchange.com/exchange/news/market-news/market-news-detail/UKW/14330541.html
thus:-
£0.01735 a share x 1,517,537,310 = £26,329,272.3285
£26m
The The Schroder Oriental Income Fund, has the investment objective of the Company is to provide a total return for investors primarily through investments in equities and equity related investments, of companies which are based in, or which derive a significant proportion of their revenues from, the Asia Pacific region and which offer attractive yields.
Its top ten holdings are:
Taiwan Semiconductor Manufacturing Co Ltd 8.1% of the fund
2 Samsung Electronics Co Ltd 5.9% of the fund
3 Swire Pacific Ltd 3.6% of the fund
4 FORTUNE REIT NPV (HK LISTING) 3.5% of the fund
5 Sands China Ltd 3.5% of the fund
6 BOC Hong Kong Holdings Ltd 2.8% of the fund
7 Kerry Properties Ltd 2.5% of the fund
8 Hon Hai Precision Industry Co Ltd 2.5% of the fund
9 BHP Group PLC 2.5% of the fund
10 Singapore Telecommunications Ltd 2.5% of the fund
Another month, guess what, take a lucky guess, it is the same old story, HM Government, spends more money than it receives via taxes and duties.
Another deficit month, thus to bridge the gap, needs to borrow on the bond market In January 2020 , the HM Government had to borrow money to meet the difference between tax revenues and public sector expenditure. The term for this is The PSNCR: The Public Sector Net Cash Requirement. There were “only” 4 auctions of Gilts (UK Government Bonds) by the UK Debt Management Office to raise cash for HM Treasury:-
28-Jan-2020 0 7/8% Treasury Gilt 2029 2,750.000 Million
21-Jan-2020 1¼ % Treasury Gilt 2041 2,545.8720 Million
14-Jan-2020 0 5/8% Treasury Gilt 2025 3,250.0000 Million
09-Jan-2020 0 1/8% Index-linked Treasury Gilt 2028 1,056.0370 Million
07-Jan-2020 0 7/8% Treasury Gilt 2029 3,162.4970 Million
When you add the cash raised:-
£2,750.000Million + £2,545.8720Million + 3,250.0000Million + £1,056.0370Million + £3,162.4970Million = £12,764.406 Million
£12,764.406 Million = £12.764406Billion
On another way of looking at it, is in the 31 days in Jan 2020, HM Government borrowed:- £411.7550322580645Million each day for the 31 days.
We are fortunate, while the global banking and financial markets still has the confidence in HM Government to buy the Gilts (Lend money to the UK), the budget deficit keeps rising. What is also alarming, is the dates these bond mature 2025, 2028, 2029 and 2041. All long term borrowings, we are mortgaging our futures, but at least “We Are In It Together….”
The Legal & General battery ETF is growing.https://www.londonstockexchange.com/exchange/prices-and-markets/ETFs/company-summary/IE00BF0M2Z96ZZGBXETF2.html
Investing in Lithium Ion Battery stocks
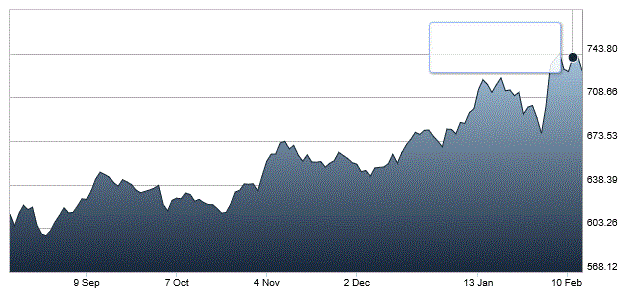
https://www.theguardian.com/business/2020/feb/09/ray-dalio-billionaire-hedge-fund-capitalism
Ray Dalio, who has a near $19bn fortune, is one of a handful of the 0.01% to go public with concerns about the system that created that wealth
Ray Dalio, the billionaire investor, has just released his first children’s book. It’s a bedtime story he hopes will inspire a new generation of entrepreneurs and leaders. There are other stories that keep Dalio awake at night.
Stock markets have soared in recent years, employers are struggling to find workers, inflation is under control. And yet: “This period is very similar to that of the 1930s,” he says. “We’re at each other’s throats when these are the best of times. I worry about the bad times.”
Dalio, the founder of investment firm Bridgewater Associates, one of the world’s largest hedge funds, and a man with a personal fortune that tops $18.7bn, is one of a handful of the 0.01% who have gone public with their worries about the system that created that wealth.
“The world has gone mad, and the system is broken,” he wrote in a series of viral posts on the issues he sees in the modern economy last year.
The gap between rich and poor has grown too wide, and most people have not seen real income growth in decades, he wrote. The economy is stacked against those at the bottom. Education, healthcare, the tax system, the prison system and political deadlock have created a situation that presents an “existential risk” to the US and the rest of the world. It was a searing indictment of the status quo, not least because it came from someone who had benefited from it the most.
While on the surface the financial numbers of the world economy look good, it is clear that the Great Recession has left a pool of seething resentment in its wake. Nationalism is sweeping the world and the political order is being overturned. As Eric Hoffer pointed out in The True Believer, his book on mass movements, the French and Russian revolutions came not at economic and social nadirs, but as living conditions were improving.
Dalio hopes, in part, that his latest book can help people at an individual level to address the dilemmas they now face and will always face – no matter what the political or economic headwinds. An illustrated distillation of his bestselling book Principles for Success, the book offers the life lessons Dalio says helped him not only amass one of the world’s largest fortunes but live a successful life.
In the book, an unnamed hero in a backpack and Pharrell Williams hat negotiates a series of problems, a dark wood, a mountaintop and the loss of said hat, as he chases a blue diamond. While it’s not really clear what the diamond represents (maybe $18.7bn?), it’s really about the journey. Over 157 pages, Dalio shares his insights, a five-point system for assessing our weaknesses and overcoming problems, and somewhat hokey aphoristic formulae like Dreams + Reality + Determination = A Successful Life and Pain + Reflection = Progress.
The Hungry Caterpillar it ain’t.
He says he wrote the book because friends said they wanted it for their kids. It’s hard to see pajama-clad children clamoring for Principles (“Daddy, is there a follow-up on compound interest?”) but the original Principles has sold over a million copies and been downloaded 3 million times, so who knows? Kids these days!
“I think everybody would benefit from writing down their principles, not in an abstract way,” says Dalio. “It serves a purpose of bringing clarity to your thinking. It’s a joy. I think these principles apply to anybody, whatever their circumstances are.” He is hoping some of his peers will follow suit.
But while he is hopeful that his principles can be a practical benefit at the individual level, Dalio is worried about the future of society those individuals live in. “I think the capitalism system needs to be reformed, because first of all it’s not fair. And secondly, it’s not optimally productive.”
The system that Dalio grew up in, he says, is very different to the one we have today. Born in 1949 the son of a jazz musician, Dalio grew up in the Jackson Heights neighborhood of New York City’s Queens. He had loving parents, attended a good public school and entered “a job market that offered me equal opportunity”.
He began trading at the age of 12 and opened Bridgewater in 1981. By 2005, it had become the largest hedge fund in the world, betting on “macro” world-shaping economic events. He made investors a fortune correctly predicting the last recession when others bet it would be business as usual.
To have these things and use them to build a great life is what was meant by living the American Dream,” he wrote last year. Now, Dalio argues, capitalism has broken that promise. The relentless pursuit of profit over people has created a structural flaw that threatens to bring the whole system down. “All systems should evolve. We all need to evolve. We need to be reformed constantly,” says Dalio.
He is, of course, not alone in thinking this. Democratic presidential candidates including Bernie Sanders and Elizabeth Warren would be entirely in agreement if they weren’t so against him. The problem for Dalio is whether anyone can hear this message from the mouth of a billionaire. Sanders has said billionaires should not exist. Warren is selling mugs stamped “Billionaire Tears” as she pushes plans for a huge hike in taxes on the super wealthy.
Dalio won’t talk politics in the specifics, but he says he has a strong aversion to any kind of prejudice, and worries about the vitriol being leveled at him and his Croeseus-like cohorts.
“When we get into an environment of demonizing people or stereotyping people. It’s like if you call a leader, a billionaire, evil … it’s almost like saying you’re a poor person, then that’s evil or you’re a Jew or a black person, and that’s evil. I think demonizing a category of people is a very bad thing,” he says.
If we are to find a way out of this mess, he says, it’ll be “with the collective involvement of people who bring not only different perspectives, but different skills to bear” on the problems.
“This engineering exercise has got to be done with skill so that there’s a redistribution of opportunity and a redistribution so that productivity is increased,” he says. “Generally speaking, the capitalists focus on increasing the size of the pie, but not on dividing it well. Socialists focus more on dividing it well, not on how to increase its size.
“I think that we have to work together and this all has to be done in a bipartisan or not partisan way, because I think that right now you’re producing such anger and division and that is our greatest risk,” he says.
It’s a belief that many of his plutocratic peers share, says Dalio. The reaction to his capitalist critique from fellow billionaires has been “overwhelmingly agreement, although not open agreement,” he says.
“I’ll tell you what the fear is. It’s not that they will be taxed more. That’s interesting, because I think most people think that that’s their main fear. The main fear is that the system of making productivity work will be hurt,” he says.
Just like corporations, billionaires are people too. Dalio is not alone in believing he has an answer to the problem that created him. Donald Trump rode into office on a wave of populist economics. Mike Bloomberg (net worth $60bn) and Tom Steyer ($1.6bn) want to replace him.
Theirs is that old, radically conservative, message: everything must change so that everything can stay the same. The question now is whether the system that produced Dalio, his principles and peers can survive the world they created. And if not, what comes after?
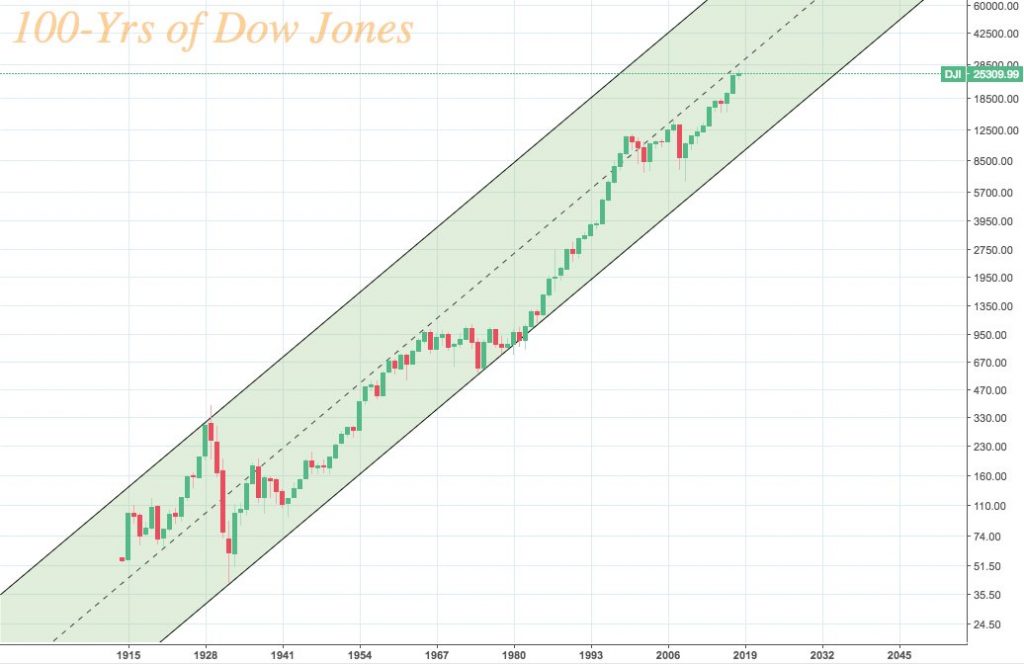
On the 3rd Feb this month, United Utilities paid out is Feb 2020 Dividend.
14.2p a share.
The total voting rights in the company were 681,888,418
thus:
681,888,418 x £0.142 = £96,828,155.356
That is £96m
5% yield.
Bernie Ebbers is dead.

Bernie Ebbers, who has died at the age of 78, was a big man in every sense of the word.
The bearded former nightclub bouncer officially stood at 6 foot 4 inches but, typically dressed in a Stetson and cowboy boots, looked even bigger.
The company he built, WorldCom, briefly became one of the world’s biggest telecoms businesses and Mr Ebbers one of America’s richest people.
However, unfortunately for Mr Ebbers, he is more likely to be remembered for his role in what remains one of the world’s biggest accounting frauds.
His rise was one of the great rags-to-riches stories that America loves
Born in 1941 in Edmonton, Canada, Mr Ebbers was the son of a travelling salesman who relocated his family first to California and then to New Mexico, where he attended school on a Navajo reservation.
After college, Mr Ebbers returned to Canada, where he worked initially as a nightclub bouncer and as a milkman.
He later recalled: “Delivering milk day to day in 30-below-zero weather isn’t a real interesting thing to do for the rest of your life.”
He went on to work as a basketball coach, before working in a clothing warehouse and then buying a motel in Mississippi, which he went on to build into a small chain.
In 1984, the opportunity to do something bigger came along.
The Reagan administration, as with the Thatcher government in Britain at that time, was opening up America’s telecoms sector to competition.
AT&T’s effective monopoly was taken away from it as the government sought to encourage others to enter the sector. The deeply religious Mr Ebbers was invited by David Singleton, one of the partners at his local prayer group, to meet two entrepreneurs, Murray Waldron and Bill Fields, who were keen on setting up such a business.
The four met at a diner in Hattiesburg, Mississippi, to thrash out a plan that involved reselling long-distance lines to small and medium-sized businesses. The enterprise was, at the suggestion of a waitress, named Long Distance Discount Service. The company was to trade under that moniker until, in 1995, it changed its name to WorldCom.
By then, it was one of America’s biggest telecoms players, having acquired dozens of smaller players worth billions of dollars in total.
The company first burst onto the City’s consciousness in a big way when, in late 1997, it gate-crashed what would have been the biggest deal in British corporate history.
BT had announced plans in November 1996 to buy MCI, a US telecoms rival, in a cash-and-shares deal valuing the latter at a then-massive £15bn. The combined business would have been second only to AT&T, the US giant, in the global telecoms market.
Over subsequent months, as MCI’s financial performance worsened, BT sought to reduce the price it was paying. Then, to its dismay, WorldCom emerged with a higher offer.
With typical bravado, Mr Ebbers told reporters: “We are able to make a superior offer for MCI because we can realise far greater synergies and savings than BT can. They just don’t live here.”
The enlarged MCI-WorldCom was, by then, a major force in what was then the emerging internet market. Mr Ebbers had realised, early on, that there was more money to be made by owning fibre-optic lines down which data could be sent than there could from re-selling space on long-distance phone lines.
All the while, despite resembling a swaggering cowboy, he was carefully cultivating the image of a simple ‘aw shucks’ Southern Baptist who had little understanding of the products his company sold. For many years he did not use a mobile phone and claimed he only sent his first email in 1999.
That was the year in which WorldCom’s stock price peaked and it achieved a stock market valuation of $160bn.
It was also the year in which the company embarked on what Mr Ebbers hoped would be its biggest deal yet – a $116bn cash-and-share offer for rival Sprint in what would have been a combination of America’s second and third-largest telecoms companies.
But the deal was blocked by competition regulators in both the United States and the EU and, as the dot-com bubble burst in 2000, WorldCom’s shares started to fall and worries about its debts began to rise.
Mr Ebbers quit in April 2002 amid revelations that he had borrowed nearly $400m from the company.
By then, its stock market value had shrivelled to $7bn and the Securities & Exchange Commission, America’s top financial regulator, was sniffing around.
Three months later, WorldCom was forced to file for bankruptcy protection, while by the end of the year it emerged that the company had fraudulently exaggerated its earnings by $11bn. Investors in the company lost billions.
Despite all this, Mr Ebbers remained popular in Mississippi, where he had given hundreds of millions of dollars to local charities.
On the Sunday after he was ousted, in 2002, Mr Ebbers walked to the front of his church at the end of the service to tell the congregation: “I just want you to know you aren’t going to church with a crook.”
The SEC begged to differ and, in 2005, a federal jury in Manhattan found him guilty of fraud, conspiracy and giving securities regulators false documents.
His argument that he had been too high up the corporate food chain in WorldCom to know about the accounting fraud was undermined when the company’s former chief financial officer, Scott Sullivan, testified against him.
Me Ebbers was sentenced to 25 years in prison and was among a number of 1990s US corporate chieftains, including Dennis Kozlowski of Tyco, Jeffrey Skilling of Enron, John Rigas of Adelphia Communications and Martha Stewart of Martha Stewart Living, who were jailed in the 2000s for various misdemeanours.
He was released just before Christmas on account of his failing health and died on Sunday evening.
His passing marks the end of a remarkable story which came to be a byword for corporate fraud. WorldCom’s collapse remained the biggest on record until Lehman Brothers failed in 2008.

Today, the world’s premier Telecoms and Media group pays out its Feb dividend.
4.62p a share.
https://www.londonstockexchange.com/exchange/news/market-news/market-news-detail/BT.A/14367114.html
The total number of voting rights in BT Group plc on that date was 9,882,195,854
Thus:-
£0.0462 x 9,882,195,854 = £456,557,448.4548
That is £456 Million.
6.91% yield.
Wise people invest first and then spend what is left. Broke people, spend first and invest what is left over.
Today, UK Mortgages PLC pays out its quarterly dividend.
1.125p a share.
https://mma.prnewswire.com/media/1058305/UKML_Factsheet___November_2019.pdf
Thus:
£0.0125*273,000,000 = £3,412,500
That is £3.4million.
Another month, guess what, take a lucky guess, it is the same old story, HM Government, spends more money than it receives via taxes and duties.
Another deficit month, thus to bridge the gap, needs to borrow on the bond market In December 2019 , the HM Government had to borrow money to meet the difference between tax revenues and public sector expenditure. The term for this is The PSNCR: The Public Sector Net Cash Requirement. There were “only” 4 auctions of Gilts (UK Government Bonds) by the UK Debt Management Office to raise cash for HM Treasury:-
17-Dec-2019 2% Treasury Gilt 2025 3,162.4960 Million
11-Dec-2019 0 1/8% Index-linked Treasury Gilt 2048 500.0000 Million
05-Dec-2019 1¾% Treasury Gilt 2049 2,082.4500 Million
03-Dec-2019 0 7/8% Treasury Gilt 2029 3,162.4980 Million
When you add the cash raised:-
£3,162.4960Million + £500.0000Million + 2,082.4500Million + 3,162.4980Million = £8907.444 Million
£8907.444 Million = £8.907444 Billion
On another way of looking at it, is in the 31 days in December, HM Government borrowed:- £287.3369032258065Million each day for the 31 days.
We are fortunate, while the global banking and financial markets still has the confidence in HM Government to buy the Gilts (Lend money to the UK), the budget deficit keeps rising. What is also alarming, is the dates these bond mature 2025, 2029, 2029, 2048 and 2049. All long term borrowings, we are mortgaging our futures, but at least “We Are In It Together….”
The Ashoka India Equity Investment Trust PLC is a London listed investment trust. The investment objective of the Company is to achieve long-term capital appreciation, mainly through investment in securities listed in India and listed securities of companies with a significant presence in India.
It’s top ten holdings are:-
Bajaj Finance, Financials, 7.2% of the fund
Bajaj Finserve, Financials, 7.1% of the fund
HDFC Bank, Financials, 4.9% of the fund
HDFC Asset Management Co, Financials, 4.7% of the fund
Asian Paints, Materials, 4.2% of the fund
Titan Co, Consumer Discretionary, 3.7% of the fund
NIIT Technologies, Information Technology, 3.5% of the fund
L&T Technology Services, Industrials, 3.5% of the fund
Navin Fluorine International, Materials, 3.4% of the fund
Maruti Suzuki India, Consumer Discretionary, 3.2% of the fund
Total Portfolio 45.2%
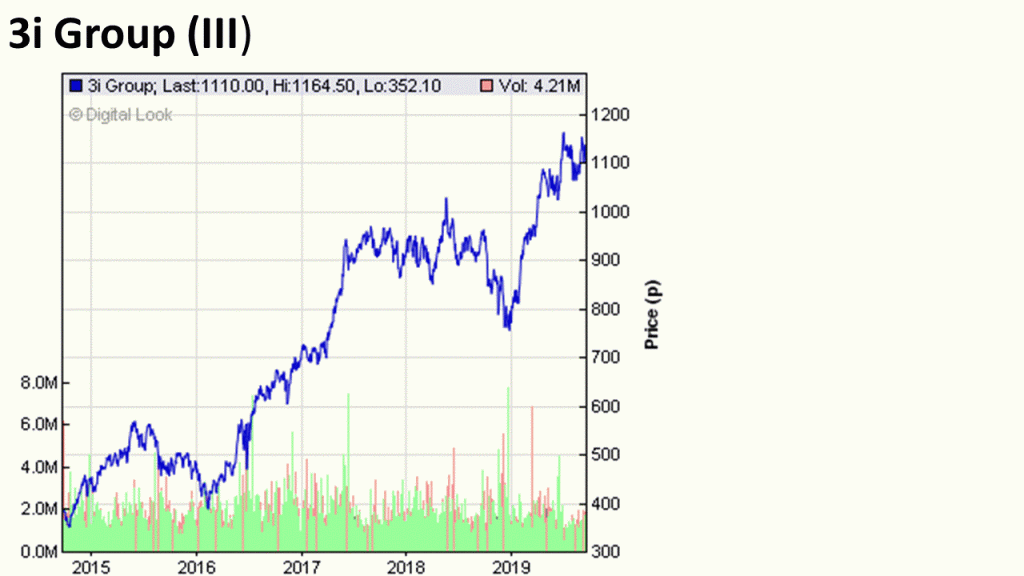
3i Infrastructure paid out its Jan 2020 dividend on Monday 13th Jan 2020.
4.6p a share.
https://www.londonstockexchange.com/exchange/news/market-news/market-news-detail/3IN/14288784.html
3i Infrastructure plc has 891,434,010 issued ordinary shares with voting rights admitted to trading on a regulated and prescribed market.
Thus:-
891,434,010 x £0.046 = £41,005,964.46
That is £41m
A yield of 4.37%
ISPY LEGAL & GENERAL UCITS ETF PLC L&G ISE CYBER SECURITY GO UCITS ETF
You cannot legislate the poor into freedom by legislating the wealthy out of freedom. What one person receives without working for, another person must work for without receiving. The government cannot give to anybody anything that the government does not first take from somebody else. When half of the people get the idea that they do not have to work because the other half is going to take care of them, and when the other half gets the idea that it does no good to work because somebody else is going to get what they work for, that my dear friend, is the end of any nation. You cannot multiply wealth by dividing it

The BMO Managed Portfolio Trust PLC is a funds of funds.
https://www.bmogam.com/managed-portfolio-trust/
The Managed Portfolio Trust is a ‘multi-manager’ portfolio, investing in trusts managed by different investment providers. The diversification – The multi-manager approach ensures a broad mix of holdings, including ‘alternative’ assets.
Its top ten holdings are:-
Monks Investment Trust. 4.3% of the fund
Allianz Technology Trust 3.5% of the fund
HgCapital Trust 3.3% of the fund
Polar Capital Technology Trust 3.1% of the fund
Worldwide Healthcare Trust 3.1% of the fund
RIT Capital Partners 3.0% of the fund
Mid Wynd International Investment Trust 2.9% of the fund
BH Macro 2.9% of the fund
Impax Environmental Markets 2.9% of the fund
TR Property Investment Trust 2.8% of the fund
Geographic Breakdown:-
UK 26.0% of the fund
North America 24.0% of the fund
Europe 15.0% of the fund
Cash 12.0% of the fund
Far East & Pacific 9.0% of the fund
Japan 5.0% of the fund
Fixed Interest 3.0% of the fund
China 3.0% of the fund
South America 1.0% of the fund
Africa 1.0% of the fund
Other 1.0
M&G, the UK investment house, is in the press at the moment regarding its property fund. M&G temporarily suspended dealings in its property portfolio. It said Brexit-related political uncertainty and structural shifts in the UK retail sector had made it difficult to sell commercial property to meet demand from investors to have their cash returned M&G’s top holdings at the end of October 2019 were:-
1 New Square, Bedfont Lakes office park – 7.09% of the fund (Office development in Heathrow)
2 Wales Designer Outlet, Bridgend – 5.07% (Tenants include Marks & Spencer, Gap and Next)
3 Parc Trostre retail park, Llanelli, Wales – 4.5% (Tenants include M&S, Debenhams, New Look, Primark, River Island and Next)
4 Fremlin Walk shopping centre, Maidstone – 3.47% (Tenants include House of Fraser, Laura Ashley, HMV, Paperchase, River Island, Superdry, Topshop and Zara)
5 Iron Mountain distribution warehouse, Belvedere, Kent – 3.41%
6 Riverside retail park, Chelmsford – 3.39% (Tenants include Sports Direct, Matalan, Home Bargains, Poundstretcher, Smyths Toys)
7 Aurora, 120 Bothwell Street, Glasgow – 3.21% (Office building)
8 Gracechurch Centre, Sutton Coldfield near Birmingham – 2.82% (Tenants include House of Fraser, New Look, Sports Direct, Topshop, River Island and JD Sports)
9 Enterprises House, Uxbridge – 2.47% (UK and European headquarters for Coca-Cola)
10 Lindis retail park, Lincoln – 2.42% (Tenants include Sainsbury’s, Matalan, Bargain Buys and Domino’s)
Yesterday, Rolls Royce PLC paid out its Jan 2020 Dividend.
4.6p a share.
The total number of voting rights in the Company is 1,930,995,313 https://www.londonstockexchange.com/exchange/news/market-news/market-news-detail/RR./14366975.html
Thus:-
1,930,995,313 x 0.046 = £88,825,784.398
That is £88m
1.7% yield
Yesterday (Tue 10th December), IBM paid out this dividend of $1.62 a share.
Reading the annual report:
https://www.ibm.com/annualreport/assets/downloads/IBM_Annual_Report_2018.pdf
We discover that The authorized capital stock of IBM consists of 4,687,500,000 shares of common stock with a $.20 per share par value, of which 892,479,411 shares were outstanding at December 31, 2018 and 150,000,000 shares of preferred stock with a $.01 per share par value, none of which were outstanding at December 31, 2018
Thus:
892,479,411 x current share price of $132 = $117,807,282,252
That is $117bn.
Now the dividend of $1.62 a share will cost IBM:-
$1.62 a share x 892,479,411 = $1,445,816,645.82
That is $1.445 Billon.
Amazon.com, the Ecommerce giant, has huge sales.
Total in 2018 was $ 141,366 Million.
The company carries debt.
https://ir.aboutamazon.com/static-files/0f9e36b1-7e1e-4b52-be17-145dc9d8b5ec
As of December 31, 2018, Amazon had $24.3 billion of unsecured senior notes outstanding.
2.60% Notes due on December 5, 2019 $1,000million
1.90% Notes due on August 21, 2020 $1,000million
3.30% Notes due on December 5, 2021 $1,000million
2.50% Notes due on November 29, 2022 $1,250million
2.40% Notes due on February 22, 2023 $1,000million
2.80% Notes due on August 22, 2024 $2,000million
3.80% Notes due on December 5, 2024 $1,250million
5.20% Notes due on December 3, 2025 $1,000million
3.15% Notes due on August 22, 2027 $3,500million
4.80% Notes due on December 5, 2034 $1,250million
3.875% Notes due on August 22, 2037 $2,750million
4.950% Notes due on December 5, 2044 $1,500million
4.050% Notes due on August 22, 2047 $3,500million
4.250% Notes due on August 22, 2057 $2,250million
Credit Facility $594million.
Other long-term debt $100million.
Total debt $24,942 million
Warren Buffet said:-
“Do not save what is left after spending, but spend what is left after saving. “
The Gresham House Energy Storage Fund paid on the 20th December is quarterly dividend.
https://greshamhouse.com/real-assets/new-energy/gresham-house-energy-storage-fund-plc/
1p a share:-
https://www.londonstockexchange.com/exchange/news/market-news/market-news-detail/GRID/14288697.html
The total number of voting rights of the Company is 204,270,650
Thus:- 204,270,650 x £0.01 = £2,042,706.50
That is £2m
Yesterday BP paid out its quarterly dividend.
It was $0.1025 or 7.825p a share:-
The total number of voting rights in BP p.l.c. is 20,276,846,871
https://www.londonstockexchange.com/exchange/news/market-news/market-news-detail/BP./14329750.html
Thus:- 20,276,846,871 x 7.825p = £1,586,663,267.65575
That is £1586 Million = £1.586 Billion
6% yield
Yesterday, Royal Dutch Shell paid out its quarterly dividend a share.
Royal Dutch Shell is dual listed, Shell A and Shell B class of shares:-
[1] Royal Dutch Shell A FTSE 100 $0.47 (35.73p)
&
[2] Royal Dutch Shell B FTSE 100 $0.47 (35.73p)
Royal Dutch Shell plc´s capital as at 25 November 2019 consists of 4,191,452,034 A shares and 3,733,998,448 B shares, each with equal voting rights. Royal Dutch Shell plc holds no ordinary shares in Treasury
https://www.londonstockexchange.com/exchange/news/market-news/market-news-detail/RDSA/14322111.html
Thus:
4,191,452,034 A shares x 35.73p = £1,497,605,811.7482
3,733,998,448 B shares x 35.73p = £1,334,157,645.4704
£1,497,605,811.7482 + £1,334,157,645.4704 = £2,831,763,457.2186
That is £2,831 Million = £2.831 Billion.
Delicious.
The world of television and films has changed with companies like Amazon Prime, Netflix who stream content to subscribers.
www.netflix.com is a pioneer in this arena.
Reading its annual report we can discover its level of debt.
https://s22.q4cdn.com/959853165/files/doc_financials/annual_reports/2018/Form-10K_Q418_Filed.pdf
$10,449 Million of Long Term debt, that has been accumulated through various bond isssues:
5.375% Senior Notes $500million issued in February 2013 matures in February 2021
5.50% Senior Notes $700million issued in February 2015 matures in February 2022
5.750% Senior Notes $400million issued in February 2014 matures in March 2024
5.875% Senior Notes $800million issued in February 2015 matures in February 2025
4.375% Senior Notes $1,000million issued in October 2016 matures in November 2026
3.625% Senior Notes $1,489million issued in May 2017 matures in May 2027
4.875% Senior Notes $1,600million issued in October 2017 matures in April 2028
5.875% Senior Notes $1,900million issued in April 2018 matures in November 2028
4.625% Senior Notes $1,260million issued in October matures in 2018
6.375% Senior Notes $800million issued in October 2018 matures in May 2029
Total $10,449 Million = $10.449 Billion
Look at the interest rates, in a climate of near zero rates, they are paying a high cost of capital.
Paul Volcker, the former head of the US central bank who was known for fighting inflation, has died at the age of 92. Appointed chair of the Federal Reserve in 1979, Mr Volcker dramatically raised interest rates to combat inflation. The move drove the US into recession, but was credited with creating the conditions for long-term growth. It also helped to burnish the bank’s reputation for independence. Mr Volcker’s tenure at the top of the Fed ended in 1987. More recently he had advised former US President Barack Obama on bank regulation following the financial crisis, overseen the return of money to Holocaust victims, and investigated a United Nations oil-for-food programme.
https://www.federalreserve.gov/newsevents/pressreleases/other20191209a.htm
“I am deeply saddened by the passing of Paul Volcker. He believed there was no higher calling than public service. His life exemplified the highest ideals–integrity, courage, and a commitment to do what was best for all Americans. His contributions to the nation left a lasting legacy. My colleagues and I at the Federal Reserve mourn this loss and send our condolences to his family”
The BlackRock Greater Europe Investment Trust plc is a London listed investment trust.
The Company aims to provide capital growth, primarily through investment in a focused portfolio constructed from a combination of the securities of large, mid and small capitalisation European companies, together with some investment in the developing markets of Europe Its top ten holdings are:-
SAP Germany 7.0% of the fund
Safran France 6.8% of the fund
Adidas Germany 5.8% of the fund
Sika Switzerland 5.8% of the fund
Novo Nordisk Denmark 5.7% of the fund
Royal Unibrew Denmark 5.3% of the fund
Lonza Group Switzerland 4.6% of the fund
ASML Netherlands 4.6% of the fund
DSV Denmark 4.4% of the fund
RELX United Kingdom 4.4% of the fund
http://www.shareshop.hsbc.co.uk/shareshop/security.cgi?csi=104481&action=
1.5% yield
Norges Bank, the central bank of Norway, is one of the largest investment managers in the world.
It is due to Norges Bank is the investment manager to the Norway’s Sovereign Wealth Fund (the petroleum fund of Norway). Norges Bank Investment Management, has taken a 3% stake in Vodafone.
https://www.londonstockexchange.com/exchange/news/market-news/market-news-detail/VOD/14322109.html
The Montanaro UK Smaller Companies Investment Trust PLC is a London listed investment trust.
http://www.montanaro.co.uk/our-trusts/uk-smaller-companies-investment-trust/overview
The Trust aims to achieve capital appreciation through investing in small quoted companies listed on the London Stock Exchange or traded on the Alternative Investment Market (“AIM”) and to achieve relative outperformance of its benchmark, the Numis Smaller Companies Index (excluding investment companies) (“NSCI”).
Its top ten holdings are:-
Big Yellow Group 4.1% of the fund
4Imprint Group 4.1% of the fund
Marshalls 4.0% of the fund
Hilton Food Group 3.5% of the fund
Integrafin 3.5% of the fund
Polypipe Group 3.1% of the fund
James Fisher & Sons 2.9% of the fund
Brewin Dolphin Holdings 2.8% of the fund
Ideagen 2.8% of the fund
XP Power 2.8% of the fund
Total = 33.5% of the fund
http://www.shareshop.hsbc.co.uk/shareshop/security.cgi?csi=12895
3.2% yield
On Friday 22nd November, Tesco PLC paid out it’s November 2019 Dividend.
2.65p a share
https://www.londonstockexchange.com/exchange/news/market-news/market-news-detail/TSCO/13811216.html
The total number of voting rights in the Company is 9,793,482,136.
Thus: 9,793,482,136 x £0.0265 = £259,527,276.604
That is £259million
http://www.shareshop.hsbc.co.uk/shareshop/security.cgi?csi=10091
A yield of 2.5%
The Polar Capital Technology Investment Trust is a London listed investment trust.
http://www.Polarcapitaltechnologytrust.co.uk
The top Fifteen Equity Holdings and Sector and Geographic Exposures:-
Top 15 Long Position %
Microsoft 9.4%
Alphabet 8.0%
Apple 7.1%
Facebook 4.2%
Samsung Electronics 3.6%
Alibaba Group Holding 2.8%
TSMC 2.7%
Tencent 2.2%
Advanced Micro Devices 2.0%
Salesforce.com 1.9%
Amazon 1.6%
Qualcomm 1.6%
PayPal Holdings 1.4%
Analog Devices 1.4%
Adobe Systems 1.2%
Total 51.1%
Sector Exposure Total %
Software 27.3%
Semiconductors & Semiconductor Equipment 16.9%
Interactive Media & Services 16.0%
Technology Hardware, Storage & Peripherals 11.1%
Electronic Equipment, Instruments & Components 5.3%
IT Services 4.8%
Internet & Direct Marketing Retail 4.7%
Entertainment 2.8%
Machinery 1.3%
Communications Equipment 0.8%
Healthcare Equipment & Supplies 0.5%
Aerospace & Defence 0.5%
Electrical Equipment 0.4%
Auto Components 0.3%
Life Sciences Tools & Services 0.3%
Road & Rail 0.3%
Diversified Consumer Services 0.3%
Diversified Telecommunication Services 0.2%
Professional Services 0.2%
Building Products 0.1%
Cash 5.8%
Total 100.0%
Geographic Exposure Total %
US & Canada 68.5%
Asia Pac (ex-Japan) 13.0%
Japan 5.8% Europe (ex UK) 5.0%
UK 1.3% Latin America 0.4%
Middle East & Africa 0.1%
Cash 5.8%
Total 100.0%
Another month, guess what, take a lucky guess, it is the same old story, HM Government, spends more money than it receives via taxes and duties.
Another deficit month, thus to bridge the gap, needs to borrow on the bond market In October 2019 , the HM Government had to borrow money to meet the difference between tax revenues and public sector expenditure. The term for this is The PSNCR: The Public Sector Net Cash Requirement. There were “only” 5 auctions of Gilts (UK Government Bonds) by the UK Debt Management Office to raise cash for HM Treasury:-
29-Oct-2019 0 1/8% Index-linked Treasury Gilt 2028 3 months £1,100.0000 Million
22-Oct-2019 0 5/8% Treasury Gilt 2025 £3,449.9970 Million
15-Oct-2019 0 7/8% Treasury Gilt 2029 £3,162.4990 Million
08-Oct-2019 0 1/8% Index-linked Treasury Gilt 2036 3 months £919.9980 Million
01-Oct-2019 1¾% Treasury Gilt 2037 £2,250.0000 Million
When you add the cash raised:-
£1,100.0000 Million + £3,449.9970 Million + £3,162.4990 Million + 919.9980 Million + £2,250.0000 Million = £10882.494 Million
£10882.494 Million = £10.882 Billion
On another way of looking at it, is in the 31 days in October, HM Government borrowed:- £351.048 Million each day for the 31 days.
We are fortunate, while the global banking and financial markets still has the confidence in HM Government to buy the Gilts (Lend money to the UK), the budget deficit keeps rising. What is also alarming, is the dates these bond mature 2025, 2028, 2029, 2036 and 2037. All long term borrowings, we are mortgaging our futures, but at least “We Are In It Together….”
Tomorrow HSBC Holdings PLC, pays out its November dividend.
It is 7.7998p a share.
https://www.londonstockexchange.com/exchange/news/market-news/market-news-detail/HSBA/14303180.html
the total number of voting rights in HSBC Holdings plc is 20,257,946,394
https://www.londonstockexchange.com/exchange/news/market-news/market-news-detail/HSBA/14289587.html
Thus:- 20,257,946,394 x £0.077998 = £1,580,079,302.839212
That is £1.580 billion. A yield of 6.9%
http://www.shareshop.hsbc.co.uk/shareshop/security.cgi?csi=10048&action=
Labour and Openreach Yesterday, HM Opposition said if it comes to power, it would nationalise parts of BT.
https://www.bbc.co.uk/news/election-2019-50427369
The shadow chancellor John McDonnell told the BBC the “visionary” £20bn plan would “ensure that broadband reaches the whole of the country”.
Some interesting facts that have not been considered by HM Opposition:-
The £20bn figure from Labour, compares to £30-40bn BT has said that it will cost to rollout fibre to the UK.
It is very ambigious whether the £20bn would also cover the cost of nationalisation, which according to Openreach’s regulatory accounts has a regulated asset value of c£13bn.
Labour’s estimated cost of maintaining Openreach at £230million pa compares to Openreach’s annual opex of about £2,000 million per year.
Any nationalisation would also have to consider many other complexities including what to do with the pension plan and the remaining business units not nationalised.
No mention about Debt’s fixed income, its debt position.
Like the big banks, big tech uses its lobbying muscle to avoid regulation, and thinks it should play by different rules. And like the banks, it could be about to wreak financial havoc on us all
In every major economic downturn in US history, the ‘villains’ have been the ‘heroes’ during the preceding boom,” said the late, great management guru Peter Drucker. I cannot help but wonder if that might be the case over the next few years, as the United States (and possibly the world) heads toward its next big slowdown. Downturns historically come about once every decade, and it has been more than that since the 2008 financial crisis. Back then, banks were the “too-big-to-fail” institutions responsible for our falling stock portfolios, home prices and salaries. Technology companies, by contrast, have led the market upswing over the past decade. But this time around, it is the big tech firms that could play the spoiler role.
ou wouldn’t think it could be so when you look at the biggest and richest tech firms today. Take Apple. Warren Buffett says he wished he owned even more Apple stock. (His Berkshire Hathaway has a 5% stake in the company.) Goldman Sachs is launching a new credit card with the tech titan, which became the world’s first $1tn market-cap company in 2018. But hidden within these bullish headlines are a number of disturbing economic trends, of which Apple is already an exemplar. Study this one company and you begin to understand how big tech companies – the new too-big-to-fail institutions – could indeed sow the seeds of the next crisis.
No matter what the Silicon Valley giants might argue, ultimately, size is a problem, just as it was for the banks. This is not because bigger is inherently bad, but because the complexity of these organisations makes them so difficult to police. Like the big banks, big tech uses its lobbying muscle to try to avoid regulation. And like the banks, it tries to sell us on the idea that it deserves to play by different rules.
Consider the financial engineering done by such firms. Like most of the largest and most profitable multinational companies, Apple has loads of cash – around $210bn at last count – as well as plenty of debt (close to $110bn). That is because – like nearly every other large, rich company – it has parked most of its spare cash in offshore bond portfolios over the past 10 years. This is part of a Kafkaesque financial shell game that has played out since the 2008 financial crisis. Back then, interest rates were lowered and central bankers flooded the economy with easy money to try to engineer a recovery. But the main beneficiaries were large companies, which issued lots of cheap debt, and used it to buy back their own shares and pay out dividends, which bolstered corporate share prices and investors, but not the real economy. The Trump corporate tax cuts added fuel to this fire. Apple, for example, was responsible for about a quarter of the $407bn in buy-backs announced in the six months or so after Trump’s tax law was passed in December 2017 – the biggest corporate tax cut in US history.
Because of this, the wealth divide has been increased, which many economists believe is not only the biggest factor in slower-than-historic trend growth, but is also driving the political populism that threatens the market system itself.
That phenomenon has been put on steroids by yet another trend epitomised by Apple: the rise of intangibles such as intellectual property and brands (both of which the company has in spades) relative to tangible goods as a share of the global economy. As Jonathan Haskel and Stian Westlake show in their book Capitalism Without Capital, this shift became noticeable around 2000, but really took off after the introduction of the iPhone in 2007. The digital economy has a tendency to create superstars, since software and internet services are so scalable and enjoy network effects (in essence, they allow a handful of companies to grow quickly and eat everyone else’s lunch). But according to Haskel and Westlake, it also seems to reduce investment across the economy as a whole. This is not only because banks are reluctant to lend to businesses whose intangible assets may simply disappear if they go belly-up, but also because of the winner-takes-all effect that a handful of companies, including Apple (and Amazon and Google), enjoy.
This is likely a key reason for the dearth of startups, declining job creation, falling demand and other disturbing trends in our bifurcated economy. Concentration of power of the sort that Apple and Amazon enjoy is a key reason for record levels of mergers and acquisitions. In telecoms and media especially, many companies have taken on significant amounts of debt in order to bulk up and compete in this new environment of streaming video and digital media.
Some of that debt is now looking shaky, which underscores that the next big crisis probably won’t emanate from banks, but from the corporate sector. Rapid growth in debt levels is historically the best predictor of a crisis. And for the past several years, the corporate bond market has been on a tear, with companies in advanced economies issuing a record amount of debt; the market grew 70% over the past decade, to reach $10.17tn in 2018. Even mediocre companies have benefited from easy money.
But as the interest rate environment changes, perhaps more quickly than was anticipated, many could be vulnerable. The Bank for International Settlements – the international body that monitors the global financial system – has warned that the long period of low rates has cooked up a larger than usual number of “zombie” companies, which will not have enough profits to make their debt payments if interest rates rise. When rates eventually do rise, warns the BIS, losses and ripple effects may be more severe than usual.
Of course, if and when the next crisis is upon us, the deflationary power of technology (meaning the way in which it drives down prices), exemplified by companies like Apple, could make it more difficult to manage. That is the final trend worth considering. Technology firms drive down the prices of lots of things, and tech-related deflation is a big part of what has kept interest rates so low for so long; it has not only constrained prices, but wages, too. The fact that interest rates are so low, in part thanks to that tech-driven deflation, means that central bankers will have much less room to navigate through any upcoming crisis. Apple and the other purveyors of intangibles have benefited more than other companies from this environment of low rates, cheap debt, and high stock prices over the past 10 years. But their power has also sowed the seeds of what could be the next big swing in the markets.
A few years ago, I had a fascinating conversation with an economist at the US Treasury’s Office of Financial Research, a small but important body that was created following the 2008 financial crisis to study market trouble, and which has since seen its funding slashed by Trump. I was trawling for information about financial risk and where it might be held, and the economist told me to look at the debt offerings and corporate bond purchases being made by the largest, richest corporations in the world, such as Apple or Google, whose market value now dwarfed that of the biggest banks and investment firms.
In a low interest rate environment, with billions of dollars in yearly earnings, these high-grade firms were issuing their own cheap debt and using it to buy up the higher-yielding corporate debt of other firms. In the search for both higher returns and for something to do with all their money, they were, in a way, acting like banks, taking large anchor positions in new corporate debt offerings and essentially underwriting them the way that JP Morgan or Goldman Sachs might. But, it is worth noting, since such companies are not regulated like banks, it is difficult to track exactly what they are buying, how much they are buying and what the market implications might be. There simply is not a paper trail the way there is in finance. Still, the idea that cash-rich tech companies might be the new systemically important institutions was compelling.
I began digging for more on the topic, and about two years later, in 2018, I came across a stunning Credit Suisse report that both confirmed and quantified the idea. The economist who wrote it, Zoltan Pozsar, forensically analysed the $1tn in corporate savings parked in offshore accounts, mostly by big tech firms. The largest and most intellectual-property-rich 10% of companies – Apple, Microsoft, Cisco, Oracle and Alphabet (Google’s parent company) among them – controlled 80% of this hoard.
According to Pozsar’s calculations, most of that money was held not in cash but in bonds – half of it in corporate bonds. The much-lauded overseas “cash” pile held by the richest American companies, a treasure that Republicans under Trump had cited as the key reason they passed their ill-advised tax “reform” plan, was actually a giant bond portfolio. And it was owned not by banks or mutual funds, which typically have such large financial holdings, but by the world’s biggest technology firms. In addition to being the most profitable and least regulated industry on the planet, the Silicon Valley giants had also become systemically crucial within the marketplace, holding assets that – if sold or downgraded – could topple the markets themselves. Hiding in plain sight was an amazing new discovery: big tech, not big banks, was the new too-big-to-fail industry.
As I began to think about the comparison, I found more and more parallels. Some of them were attitudinal. It was fascinating, for example, to see how much the technology industry’s response to the 2016 election crisis mirrored the banking industry’s behaviour in the wake of the financial crisis of 2008. Just as Wall Street had obfuscated as much as possible about what it was doing before and after the crisis, every bit of useful information about election meddling had to be clawed away from the titans of big tech.
First, they insisted that they had done nothing wrong, and that anyone who thought they had simply did not understand the technology industry. It was under extreme pressure from both press and regulators that Facebook’s Mark Zuckerberg finally turned over 3,000 Russia-linked adverts to Congress. Google and others were only marginally less evasive. Similar to Wall Street financiers at the time of the US sub-prime crisis, the tech titans have remained, years after the 2016 election, in a largely reactive posture, parting with as few details as possible, attempting to keep the asymmetric information advantages of their business model that, as in the banking industry, help generate outsized profit margins. It is a “deny and deflect” attitude similar to what we saw from financiers in 2008, and has resulted in deservedly terrible PR.
But there are more substantive similarities as well. At a meta level, I see four major likenesses in big finance and big tech: corporate mythology, opacity, complexity and size. In terms of mythology, Wall Street before 2008 sold the idea that what was good for the financial sector was good for the economy. Until quite recently, big tech tried to convince us of the same. But there are two sides to the story, and neither industry is quick to acknowledge or take responsibility for the downsides of “innovation”.
A raft of research shows us that trust in liberal democracy, government, media and nongovernmental organisations declines as social media usage rises. In Myanmar, Facebook has been leveraged to support genocide. In China, Apple and Google have bowed to government demands for censorship. In the US, of course, personal data is being collected, monetised and weaponised in ways that we are only just beginning to understand, and monopolies are squashing job creation and innovation. At this point, it is harder and harder to argue that the benefits of platform technology vastly outweigh the costs.
Big tech and big banks are also similar in the opacity and complexity of their operations. The algorithmic use of data is like the complex securitisation done by the world’s too-big-to-fail banks in the sub-prime era. Both are understood largely by industry experts who can use information asymmetry to hide risks and the nefarious things that companies profit from, such as dubious political ads.
Yet that complexity can backfire. Just as many big-bank risk managers had no idea what was going in to and coming out of the black box before 2008, big tech executives themselves can be thrown off balance by the ways in which their technology can be misused. Consider, for example, the New York Times investigation in 2018 that revealed that Facebook had allowed a number of other big tech companies, including Apple, Amazon and Microsoft, to tap sensitive user data even as it was promising to protect privacy.
Facebook entered into the data-sharing deals – which are a win-win for the big tech firms in general, to the extent that they increase traffic between the various platforms and bring more and more users to them – between 2010 and 2017 to grow its social network as fast as possible. But neither Facebook nor the other companies involved could keep track of all the implications of the arrangements for user privacy. Apple claimed to not even know it was in such a deal with Facebook, a rather stunning admission given the way in which Apple has marketed itself as a protector of user privacy. At Facebook, “some engineers and executives … considered the privacy reviews an impediment to quick innovation and growth”, read a telling line in the Times piece. And grow it has: Facebook took in more than $40bn in revenue in 2017, more than double the $17.9bn it reported for 2015.
Facebook’s prioritisation of growth over governance is egregious but not unique. The tendency to look myopically at share price as the one and only indicator of value is something fostered by Wall Street, but by no means limited to it. The obliviousness of the tech executives who cut these deals reminds me of bank executives who had no understanding of the risks built into their balance sheets until markets started to blow up during the 2008 financial crisis.
Companies tend to prioritise what can be quantified, such as earnings per share and the ratio of the stock price to earnings, and ignore (until it is too late) the harder-to-measure business risks.
It is no accident that most of the wealth in our world is being held by a smaller and smaller number of rich individuals and corporations who use financial wizardry such as tax offshoring and buy-backs to ensure that they keep it out of the hands of national governments. It is what we have been taught to think of as normal, thanks to the ideological triumph of the Chicago School of economic thought, which has, for the past five decades or so, preached, among other things, that the only purpose of corporations should be to maximise profits.
The notion of “shareholder value” is shorthand for this idea. The maximisation of shareholder value is part of the larger process of “financialisation”. It is a process that has risen, in tandem with the Chicago School of thinking, since the 1980s, and has created a situation in which markets have become not a conduit for supporting the real economy, as Adam Smith would have said they should be, but rather, the tail that wags the dog.
“Consumer welfare,” rather than citizen welfare, is our primary concern. We assume that rising share prices signify something good for the economy as a whole, as opposed to merely increasing wealth for those who own them. In this process, we have moved from being a market economy to being what Harvard law professor Michael Sandel would call a “market society”, obsessed with profit maximisation in every aspect of our lives. Our access to the basics – healthcare, education, justice – is determined by wealth. Our experiences of ourselves and those around us are thought of in transactional terms, something that is reflected in the language of the day (we “maximise” time and “monetise” relationships).
Now, with the rise of the surveillance capitalism practised by big tech, we ourselves are maximised for profit. Remember that our personal data is, for these companies and the others that harvest it, the main business input. As Larry Page himself once said when asked “What is Google?”: “If we did have a category, it would be personal information … the places you’ve seen. Communications … Sensors are really cheap … Storage is cheap. Cameras are cheap. People will generate enormous amounts of data … Everything you’ve ever heard or seen or experienced will become searchable. Your whole life will be searchable.”
Think about that. You are the raw material used to make the product that sells you to advertisers.
Financial markets have facilitated the shift toward this invasive, short-term, selfish capitalism, which has run in tandem with both globalisation and technological advancement, creating a loop in which we are constantly competing with greater numbers of people, in shorter amounts of time, for more and more consumer goods that may be cheaper thanks in part to the deflationary effects of both outsourcing and tech-based disruption, but that cannot compensate for our stagnant incomes and stressed-out lives.
But you could argue that, in a deeper way, Silicon Valley – not the old Valley that was full of garage startups and true innovators, but the financially driven Silicon Valley of today – represents the apex of the shift toward financialisation. Today the large tech companies are run by a generation of business leaders who came of age and started their firms at a time when government was viewed as the enemy, and profit maximisation was universally seen as the best way to advance the economy, and indeed society. Regulation or limits on corporate behaviour have been viewed as tyrannical or even authoritarian. “Self-regulation” has become the norm. “Consumers” have replaced citizens. All of it is reflected in the Valley’s “move fast and break things” mentality, which the tech titans view as a fait accompli. As Eric Schmidt and Jared Cohen wrote in an afterword to the paperback edition of their book: “Bemoaning the inevitable increase in the size and reach of the technology sector distracts us from the real question … Many of the changes that we discuss are inevitable. They’re coming.”
Perhaps. But the idea that this should preclude any discussion of the effects of the technology sector on the public at large is simply arrogant. There is a huge cost to this line of thinking. Consider the $1tn in wealth that has been parked offshore by the US’s largest, most IP-rich firms. A trillion is no small sum: that is an 18th of the US’s annual GDP, much of which was garnered from products and services made possible by core government-funded research and innovators. Yet US citizens have not got their fair share of that investment because of tax offshoring. It is worth noting that while the US corporate tax rate was recently lowered from 35% to 21%, most big companies have for years paid only about 20% of their income, thanks to various loopholes. The tech industry pays even less – roughly 11-15% – for this same reason: data and IP can be offshored while a factory or grocery store cannot. This points to yet another neoliberal myth – the idea that if we simply cut US tax rates, then these “American” companies will bring all their money home and invest it in job-creating goods and services in the US. But the nation’s biggest and richest companies have been at the forefront of globalisation since the 1980s. Despite small decreases in overseas revenues for the past couple of years, nearly half of all sales from S&P 500 companies come from abroad.
How, then, can such companies be perceived as being “totally committed” to the US, or, indeed, to any particular country? Their commitment, at least the way American capitalism is practised today, is to customers and investors, and when both of them are increasingly global, then it is hard to argue for any sort of special consideration for American workers or communities in the boardroom.
Tech firms are more able than any other type of company to move business abroad, because most of their wealth is not in “fixed assets” but in data, human capital, patents and software, which are not tied to physical locations (such as factories or retail stores) but can move anywhere. And as we have already learned, while those things do represent wealth, they do not create broad-based demand growth in the economy like the investments of a previous era.
“If Apple acquires a licence to a technology for a phone it manufactures in China, it does not create employment in the US, beyond the creator of the licensed technology if they are in the US,” says Daniel Alpert, a financier and a professor at Cornell University studying the effects of this shift in investment. “Apps, Netflix and Amazon movies don’t create jobs the way a new plant would.” Or, as my Financial Times colleague Martin Wolf has put it, “[Apple] is now an investment fund attached to an innovation machine and so a black hole for aggregate demand. The idea that a lower corporate tax rate would raise investment in such businesses is ludicrous.” In short, cash-rich corporations – especially tech firms – have become the financial engineers of our day.
There are the ways in which big tech is driving the mega-trends in global markets, as we have just explored. Then, there are the ways tech companies are playing in those markets that grant them an unfair advantage over consumers. For example, Google, Facebook and, increasingly, Amazon now own the digital advertising market, and can set whatever terms they like for customers. The opacity of their algorithms coupled with their dominance of their respective markets makes it impossible for customers to have an even playing field. This can lead to exploitative pricing and/or behaviours that put our privacy at risk. Consider also the way Uber uses “surge pricing” to set rates based on customers’ willingness to pay. Or the “shadow profiles” that Facebook compiles on users. Or the way in which Google and Mastercard teamed up to track whether online ads led to physical store sales, without letting Mastercard holders know they were being tracked.
Or the way Amazon secured an unusual procurement deal with local governments in the US. It was, as of 2018, allowed to purchase all the office and classroom supplies for 1,500 public agencies, including local governments and schools, around the country, without guaranteeing them fixed prices for the goods. The purchasing would be done through “dynamic pricing” – essentially another form of surge pricing, whereby the prices reflect whatever the market will withstand – with the final charges depending on bids put forward by suppliers on Amazon’s platform. It was a stunning corporate jiu-jitsu, given that the whole point of a bulk-purchasing contract is to guarantee the public sector competitive prices by bundling together demand. For all the hype about Amazon’s discounts, a study conducted by the nonprofit Institute for Local Self-Reliance concluded that one California school district would have paid 10-12% more if it had bought from Amazon. And cities that wanted to keep on using existing suppliers that did not do business on the retail giant’s platform would be forced to move that business (and those suppliers) to Amazon because of the way that deal was structured.
It is hard to ignore the parallels in Amazon’s behaviour to the lending practices of some financial groups before the 2008 crash. They, too, used dynamic pricing, in the form of variable rate sub-prime mortgage loans, and they, too, exploited huge information asymmetries in their sale of mortgage-backed securities and complex debt deals to unwary investors, not only to individuals, but also to cities such as Detroit. Amazon, for its part, has vastly more market data than the suppliers and public sector purchasers it plans to link.
As in any transaction, the party that knows the most can make the smartest deal. The bottom line is that both big-platform tech players and large financial institutions sit in the centre of an hourglass of information and commerce, taking a cut of whatever passes through. They are the house, and the house always wins.
As with the banks, systemic regulation may well be the only way to prevent big tech companies from unfairly capitalising on those advantages.
There are questions of whether Amazon or Facebook could leverage their existing positions in e-commerce or social media to unfair advantage in finance, using what they already know about our shopping and buying patterns to push us into buying the products they want us to in ways that are either a) anticompetitive, or b) predatory. There are also questions about whether they might cut and run at the first sign of market trouble, destabilising the credit markets in the process.
“Big-tech lending does not involve human intervention of a long-term relationship with the client,” said Agustín Carstens, the general manager of the Bank for International Settlements. “These loans are strictly transactional, typically short-term credit lines that can be automatically cut if a firm’s condition deteriorates. This means that, in a downturn, there could be a large drop in credit to [small and middle-sized companies] and large social costs.” If you think that sounds a lot like the situation that we were in back in 2008, you would be right.
Treating the industry like any other would undoubtedly require a significant shift in the big-tech business model, one with potential profit and share price implications. The extraordinary valuations of the big tech firms are due in part to the market’s expectations that they will remain lightly regulated, lightly taxed monopoly powers. But that is not guaranteed to be the case in the future. Antitrust and monopoly issues are fast gaining attention in Washington, where the titans of big tech may soon have a reckoning.
This is an edited extract from Don’t Be Evil: The Case Against Big Tech by Rana Foroohar, published by Allen Lane
Another month, guess what, take a lucky guess, it is the same old story, HM Government, spends more money than it receives via taxes and duties.
Another deficit month, thus to bridge the gap, needs to borrow on the bond market In September 2019 , the HM Government had to borrow money to meet the difference between tax revenues and public sector expenditure.
The term for this is The PSNCR: The Public Sector Net Cash Requirement. There were “only” 5 auctions of Gilts (UK Government Bonds) by the UK Debt Management Office to raise cash for HM Treasury:-
24-Sep-2019 0 1/8% Index-linked Treasury Gilt 2048 3 months 574.9950
05-Sep-2019 0 7/8% Treasury Gilt 2029 2,750.0000
03-Sep-2019 0 5/8% Treasury Gilt 2025 3,000.0000
When you add the cash raised:- £574.9950 Million + £2,750.0000 Million + £3,000.0000 Million = £6324.995 Million
£6324.995 Million = £6.324 Billion
Another way of looking at it, is in the 30 days in September, HM Government borrowed:- £210.83316 Million each day for the 30 days.
We are fortunate, while the global banking and financial markets still has the confidence in HM Government to buy the Gilts (Lend money to the UK), the budget deficit keeps rising. What is also alarming, is the dates these bond mature 2025, 2029 and 2048. All long term borrowings, we are mortgaging our futures, but at least “We Are In It Together….”
Vodafone PLC has recently issued a $1.5bn bond
Vodafone closed an offering of $1,500,000,000 4.25% Notes due 2050
https://www.londonstockexchange.com/exchange/news/market-news/market-news-detail/VOD/14230445.html
Thus they have borrowed $1.5bn from its creditors, for the next 31 years (from now to 2050) and each year will pay a fixed interest on this $1.5bn of 4.25%
http://www.shareshop.hsbc.co.uk/shareshop/security.cgi?username=&ac=&csi=10097&record_search=1&search_phrase=vod
UK Mortgages Quarterly Dividend. On Thursday 31st Oct, UK Mortgages PLC paid out its quarterly dividend.
https://www.londonstockexchange.com/exchange/news/market-news/market-news-detail/UKML/14262127.html
1.125p a share.
This investment fund holds high quality mortgages as its investment portfolio. it has 273,000,000 shares on circulation.
Thus:- 273,000,000 x £0.0125 = £3,412,500
That is £3.4125 million
9.1% yield….
If you buy things you do not need, soon you will have to sell things you need.
The 500 companies that make up the S&P 500 are:-
Agilent Technologies, Inc. American Airlines Group, Inc. Advance Auto Parts, Inc. Apple, Inc. AbbVie, Inc. AmerisourceBergen Corp. ABIOMED, Inc. Abbott Laboratories Accenture Plc Adobe, Inc. Analog Devices, Inc. Archer-Daniels-Midland Co. Automatic Data Processing, Inc. Alliance Data Systems Corp. Autodesk, Inc. Ameren Corp. American Electric Power Co., Inc. The AES Corp. Aflac, Inc. Allergan Plc American International Group, Inc. Apartment Investment & Management Co. Assurant, Inc. Arthur J. Gallagher & Co. Akamai Technologies, Inc. Albemarle Corp. Align Technology, Inc. Alaska Air Group, Inc. The Allstate Corp. Allegion Plc Alexion Pharmaceuticals, Inc. Applied Materials, Inc. Amcor Plc Advanced Micro Devices, Inc. AMETEK, Inc. Affiliated Managers Group, Inc. Amgen, Inc. Ameriprise Financial, Inc. American Tower Corp. Amazon.com, Inc. Arista Networks, Inc. ANSYS, Inc. Anthem, Inc. Aon Plc A. O. Smith Corp. Apache Corp. Air Products & Chemicals, Inc. Amphenol Corp. Aptiv Plc Alexandria Real Estate Equities, Inc. Arconic, Inc. Atmos Energy Corp. Activision Blizzard, Inc. AvalonBay Communities, Inc. Broadcom, Inc. Avery Dennison Corp. American Water Works Co., Inc. American Express Co. AutoZone, Inc. The Boeing Co. Bank of America Corp. Baxter International, Inc. BB&T Corp. Best Buy Co., Inc. Becton, Dickinson & Co. Franklin Resources, Inc. Brown-Forman Corp. Baker Hughes, a GE Co. Biogen, Inc. The Bank of New York Mellon Corp. Booking Holdings, Inc. BlackRock, Inc. Ball Corp. Bristol-Myers Squibb Co. Broadridge Financial Solutions, Inc. Berkshire Hathaway, Inc. Boston Scientific Corp. BorgWarner, Inc. Boston Properties, Inc. Citigroup, Inc. Conagra Brands, Inc. Cardinal Health, Inc. Caterpillar, Inc. Chubb Ltd. Cboe Global Markets, Inc. CBRE Group, Inc. CBS Corp. Crown Castle International Corp. Carnival Corp. Cadence Design Systems, Inc. Celanese Corp. Celgene Corp. Cerner Corp. CF Industries Holdings, Inc. Citizens Financial Group, Inc. (Rhode Island) Church & Dwight Co., Inc. C.H. Robinson Worldwide, Inc. Charter Communications, Inc. Cigna Corp. Cincinnati Financial Corp. Colgate-Palmolive Co. The Clorox Co. Comerica, Inc. Comcast Corp. CME Group, Inc. Chipotle Mexican Grill, Inc. Cummins, Inc. CMS Energy Corp. Centene Corp. CenterPoint Energy, Inc. Capital One Financial Corp. Cabot Oil & Gas Corp. The Cooper Cos., Inc. ConocoPhillips Costco Wholesale Corp. Coty, Inc. Campbell Soup Co. Capri Holdings Ltd. Copart, Inc. salesforce.com, inc. Cisco Systems, Inc. CSX Corp. Cintas Corp. CenturyLink, Inc. Cognizant Technology Solutions Corp. Corteva, Inc. Citrix Systems, Inc. CVS Health Corp. Chevron Corp. Concho Resources, Inc. Dominion Energy, Inc. Delta Air Lines, Inc. DuPont de Nemours, Inc. Deere & Co. Discover Financial Services Dollar General Corp. Quest Diagnostics, Inc. D.R. Horton, Inc. Danaher Corp. The Walt Disney Co. Discovery, Inc. Discovery, Inc. DISH Network Corp. Digital Realty Trust, Inc. Dollar Tree, Inc. Dover Corp. Dow, Inc. Duke Realty Corp. Darden Restaurants, Inc. DTE Energy Co. Duke Energy Corp. DaVita, Inc. Devon Energy Corp. DXC Technology Co. Electronic Arts, Inc. eBay, Inc. Ecolab, Inc. Consolidated Edison, Inc. Equifax, Inc. Edison International The Estée Lauder Companies, Inc. Eastman Chemical Co. Emerson Electric Co. EOG Resources, Inc. Equinix, Inc. Equity Residential Eversource Energy Essex Property Trust, Inc. E*TRADE Financial Corp. Eaton Corp. Plc Entergy Corp. Evergy, Inc. Edwards Lifesciences Corp. Exelon Corp. Expeditors International of Washington, Inc. Expedia Group, Inc. Extra Space Storage, Inc. Ford Motor Co. Diamondback Energy, Inc. Fastenal Co. Facebook, Inc. Fortune Brands Home & Security, Inc. Freeport-McMoRan, Inc. FedEx Corp. FirstEnergy Corp. F5 Networks, Inc. Fidelity National Information Services, Inc. Fiserv, Inc. Fifth Third Bancorp FLIR Systems, Inc. Flowserve Corp. FleetCor Technologies, Inc. FMC Corp. Fox Corp. Fox Corp. First Republic Bank (San Francisco, California) Federal Realty Investment Trust TechnipFMC Plc Fortinet, Inc. Fortive Corp. General Dynamics Corp. General Electric Co. Gilead Sciences, Inc. General Mills, Inc. Globe Life, Inc. Corning, Inc. General Motors Co. Alphabet, Inc. Alphabet, Inc. Genuine Parts Co. Global Payments, Inc. Gap, Inc. Garmin Ltd. The Goldman Sachs Group, Inc. W.W. Grainger, Inc. Halliburton Co. Hasbro, Inc. Huntington Bancshares, Inc. Hanesbrands, Inc. HCA Healthcare, Inc. HCP, Inc. The Home Depot, Inc. Hess Corp. HollyFrontier Corp. The Hartford Financial Services Group, Inc. Huntington Ingalls Industries, Inc. Hilton Worldwide Holdings, Inc. Harley-Davidson, Inc. Hologic, Inc. Honeywell International, Inc. Helmerich & Payne, Inc. Hewlett-Packard Enterprise Co. HP, Inc. H&R Block, Inc. Hormel Foods Corp. Henry Schein, Inc. Host Hotels & Resorts, Inc. The Hershey Co. Humana, Inc. International Business Machines Corp. Intercontinental Exchange, Inc. IDEXX Laboratories, Inc. IDEX Corp. International Flavors & Fragrances, Inc. Illumina, Inc. Incyte Corp. IHS Markit Ltd. Intel Corp. Intuit, Inc. International Paper Co. Interpublic Group of Cos., Inc. IPG Photonics Corp. IQVIA Holdings, Inc. Ingersoll-Rand Plc Iron Mountain, Inc. Intuitive Surgical, Inc. Gartner, Inc. Illinois Tool Works, Inc. Invesco Ltd. J.B. Hunt Transport Services, Inc. Johnson Controls International Plc Jacobs Engineering Group, Inc. Jefferies Financial Group, Inc. Jack Henry & Associates, Inc. Johnson & Johnson Juniper Networks, Inc. JPMorgan Chase & Co. Nordstrom, Inc. Kellogg Co. KeyCorp Keysight Technologies, Inc. The Kraft Heinz Co. Kimco Realty Corp. KLA Corp. Kimberly-Clark Corp. Kinder Morgan, Inc. CarMax, Inc. The Coca-Cola Co. The Kroger Co. Kohl’s Corp. Kansas City Southern Loews Corp. L Brands, Inc. Leidos Holdings, Inc. Leggett & Platt, Inc. Lennar Corp. Laboratory Corp. of America Holdings L3Harris Technologies, Inc. Linde Plc LKQ Corp. Eli Lilly & Co. Lockheed Martin Corp. Lincoln National Corp. Alliant Energy Corp. Lowe’s Cos., Inc. Lam Research Corp. Southwest Airlines Co. Lamb Weston Holdings, Inc. LyondellBasell Industries NV Macy’s, Inc. Mastercard, Inc. Mid-America Apartment Communities, Inc. Macerich Co. Marriott International, Inc. Masco Corp. McDonald’s Corp. Microchip Technology, Inc. McKesson Corp. Moody’s Corp. Mondelez International, Inc. Medtronic Plc MetLife, Inc. MGM Resorts International Mohawk Industries, Inc. McCormick & Co., Inc. MarketAxess Holdings, Inc. Martin Marietta Materials, Inc. Marsh & McLennan Cos., Inc. 3M Co. Monster Beverage Corp. Altria Group, Inc. The Mosaic Co. Marathon Petroleum Corp. Merck & Co., Inc. Marathon Oil Corp. Morgan Stanley MSCI, Inc. Microsoft Corp. Motorola Solutions, Inc. M&T Bank Corp. Mettler-Toledo International, Inc. Micron Technology, Inc. Maxim Integrated Products, Inc. Mylan NV Noble Energy, Inc. Norwegian Cruise Line Holdings Ltd. Nasdaq, Inc. NextEra Energy, Inc. Newmont Goldcorp Corp. Netflix, Inc. NiSource, Inc. NIKE, Inc. Nektar Therapeutics Nielsen Holdings Plc Northrop Grumman Corp. National Oilwell Varco, Inc. NRG Energy, Inc. Norfolk Southern Corp. NetApp, Inc. Northern Trust Corp. Nucor Corp. NVIDIA Corp. Newell Brands, Inc. News Corp. News Corp. Realty Income Corp. ONEOK, Inc. Omnicom Group, Inc. Oracle Corp. O’Reilly Automotive, Inc. Occidental Petroleum Corp. Paychex, Inc. People’s United Financial, Inc. PACCAR, Inc. Public Service Enterprise Group, Inc. PepsiCo, Inc. Pfizer Inc. Principal Financial Group, Inc. Procter & Gamble Co. Progressive Corp. Parker-Hannifin Corp. PulteGroup, Inc. Packaging Corporation of America PerkinElmer, Inc. (United States) Prologis, Inc. Philip Morris International, Inc. The PNC Financial Services Group, Inc. Pentair Plc Pinnacle West Capital Corp. PPG Industries, Inc. PPL Corp. Perrigo Co. Plc Prudential Financial, Inc. Public Storage Phillips 66 PVH Corp. Quanta Services, Inc. Pioneer Natural Resources Co. PayPal Holdings, Inc. QUALCOMM, Inc. Qorvo, Inc. Royal Caribbean Cruises Ltd. Everest Re Group Ltd. Regency Centers Corp. Regeneron Pharmaceuticals, Inc. Regions Financial Corp. Robert Half International, Inc. Raymond James Financial, Inc. Ralph Lauren Corp. ResMed, Inc. Rockwell Automation, Inc. Rollins, Inc. Roper Technologies, Inc. Ross Stores, Inc. Republic Services, Inc. Raytheon Co. SBA Communications Corp. Starbucks Corp. The Charles Schwab Corp. Sealed Air Corp. The Sherwin-Williams Co. SVB Financial Group The J. M. Smucker Co. Schlumberger NV SL Green Realty Corp. Snap-On, Inc. Synopsys, Inc. The Southern Co. Simon Property Group, Inc. S&P Global, Inc. Sempra Energy SunTrust Banks, Inc. State Street Corp. Seagate Technology Plc Constellation Brands, Inc. Stanley Black & Decker, Inc. Skyworks Solutions, Inc. Synchrony Financial Stryker Corp. Symantec Corp. Sysco Corp. AT&T, Inc. Molson Coors Brewing Co. TransDigm Group, Inc. TE Connectivity Ltd. Teleflex, Inc. Target Corp. Tiffany & Co. The TJX Cos., Inc. Thermo Fisher Scientific, Inc. T-Mobile US, Inc. Tapestry, Inc. TripAdvisor, Inc. T. Rowe Price Group, Inc. The Travelers Cos., Inc. Tractor Supply Co. Tyson Foods, Inc. Total System Services, Inc. Take-Two Interactive Software, Inc. Twitter, Inc. Texas Instruments Incorporated Textron, Inc. Under Armour, Inc. Under Armour, Inc. United Airlines Holdings, Inc. UDR, Inc. Universal Health Services, Inc. Ulta Beauty, Inc. UnitedHealth Group, Inc. Unum Group Union Pacific Corp. United Parcel Service, Inc. United Rentals, Inc. U.S. Bancorp United Technologies Corp. Visa, Inc. Varian Medical Systems, Inc. VF Corp. Viacom, Inc. Valero Energy Corp. Vulcan Materials Co. Vornado Realty Trust Verisk Analytics, Inc. VeriSign, Inc. Vertex Pharmaceuticals, Inc. Ventas, Inc. Verizon Communications, Inc. Westinghouse Air Brake Technologies Corp. Waters Corp. Walgreens Boots Alliance, Inc. WellCare Health Plans, Inc. Western Digital Corp. WEC Energy Group, Inc. Welltower, Inc. Wells Fargo & Co. Whirlpool Corp. Willis Towers Watson Plc Waste Management, Inc. The Williams Cos., Inc. Walmart, Inc. WestRock Co. The Western Union Co. Weyerhaeuser Co. Wynn Resorts Ltd. Cimarex Energy Co. Xcel Energy, Inc. Xilinx, Inc. Exxon Mobil Corp. Dentsply Sirona, Inc. Xerox Holdings Corp. Xylem, Inc. Yum! Brands, Inc. Zimmer Biomet Holdings, Inc. Zions Bancorporation NA Zoetis, Inc.
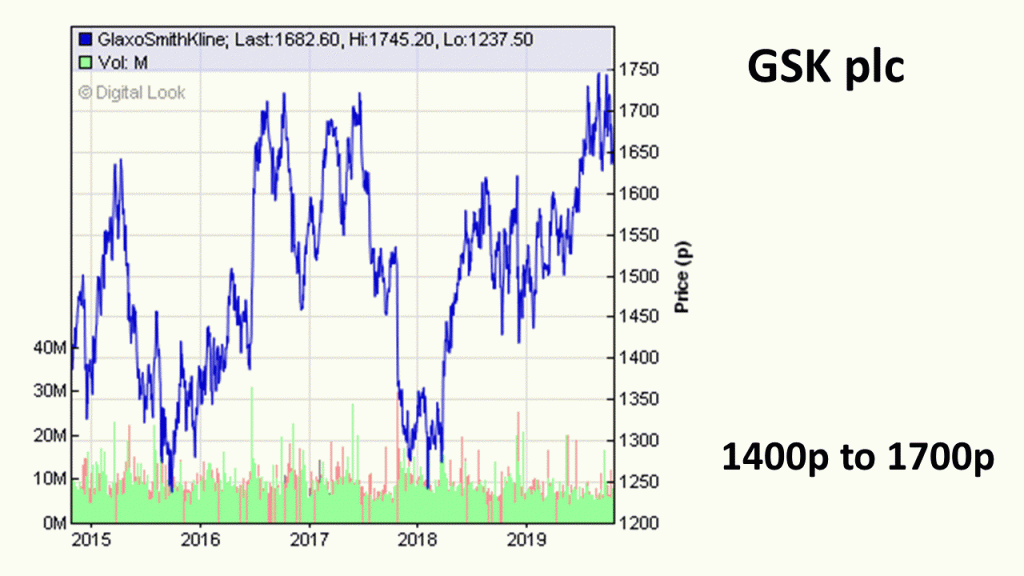
AT&T. American Telegraph and Telephone.
It is being crushed under a mountain of debt. The current debt outstanding is in total:-
$ 170,561,666,814
That is $170bn. It’s long term position is $ 157,789,862,515
That is $157.79bn.
Entity (Original Issuer) Amount Outstanding at Maturity Coupon Maturity Date Current Portion Long-term Portion Total Various $2,248,411,294 (c) various various $92,884,734 $2,155,526,560 $2,248,411,294 BellSouth Corporation $1,000,000,000 4.266% 26/04/2021 (a) $1,000,000,000 $0 $1,000,000,000 AT&T Inc. $592,000,000 Zero 27/11/2022 (b) $502,230,845 $0 $502,230,845 AT&T Inc. CHF 450,000,000 0.500% 04/12/2019 $460,923,896 $0 $460,923,896 AT&T Inc. $2,850,000,000 (d) Floating 31/12/2019 $2,850,000,000 $0 $2,850,000,000 AT&T Inc. $800,000,000 Floating 15/01/2020 $800,000,000 $0 $800,000,000 AT&T Inc. $2,750,441,000 2.450% 30/06/2020 $2,750,441,000 $0 $2,750,441,000 AT&T Inc. $686,719,000 Floating 30/06/2020 $686,719,000 $0 $686,719,000 AT&T Inc. € 2,250,000,000 Floating 03/08/2020 $0 $2,558,925,000 $2,558,925,000 AT&T Inc. CAD 1,000,000,000 3.825% 25/11/2020 $0 $763,650,248 $763,650,248 AT&T Inc. € 1,000,000,000 1.875% 04/12/2020 $0 $1,137,300,000 $1,137,300,000 AT&T Inc. $750,000,000 (d) Floating 26/01/2021 $0 $750,000,000 $750,000,000 AT&T Inc. $682,696,000 4.600% 15/02/2021 $0 $682,696,000 $682,696,000 AT&T Inc. $1,694,999,000 2.800% 17/02/2021 $0 $1,694,999,000 $1,694,999,000 AT&T Inc. $853,159,000 4.450% 15/05/2021 $0 $853,159,000 $853,159,000 AT&T Inc. $1,500,000,000 Floating 01/06/2021 $0 $1,500,000,000 $1,500,000,000 AT&T Inc. $1,500,000,000 Floating 15/07/2021 $0 $1,500,000,000 $1,500,000,000 AT&T Inc. $1,171,605,000 3.875% 15/08/2021 $0 $1,171,605,000 $1,171,605,000 AT&T Inc. € 1,000,000,000 2.650% 17/12/2021 $0 $1,137,300,000 $1,137,300,000 Michigan Bell Telephone Company $102,800,000 7.850% 15/01/2022 $0 $102,800,000 $102,800,000 Time Warner Inc. $77,900,000 4.000% 15/01/2022 $0 $77,900,000 $77,900,000 AT&T Inc. $83,184,000 7.850% 15/01/2022 $0 $83,184,000 $83,184,000 AT&T Inc. $422,057,000 4.000% 15/01/2022 $0 $422,057,000 $422,057,000 AT&T Inc. $1,456,834,000 3.000% 15/02/2022 $0 $1,456,834,000 $1,456,834,000 AT&T Inc. $1,250,000,000 3.200% 01/03/2022 $0 $1,250,000,000 $1,250,000,000 AT&T Inc. $1,012,016,000 3.800% 15/03/2022 $0 $1,012,016,000 $1,012,016,000 DIRECTV Holdings LLC / DIRECTV Financing Co., Inc. $65,028,000 3.800% 15/03/2022 $0 $65,028,000 $65,028,000 AT&T Inc. € 1,500,000,000 1.450% 01/06/2022 $0 $1,705,950,000 $1,705,950,000 Time Warner Inc. $97,308,000 3.400% 15/06/2022 $0 $97,308,000 $97,308,000 AT&T Inc. $402,679,000 3.400% 15/06/2022 $0 $402,679,000 $402,679,000 AT&T Inc. $1,961,516,000 3.000% 30/06/2022 $0 $1,961,516,000 $1,961,516,000 AT&T Inc. $1,118,743,000 2.625% 01/12/2022 $0 $1,118,743,000 $1,118,743,000 Historic TW Inc. $115,871,000 9.150% 01/02/2023 $0 $115,871,000 $115,871,000 AT&T Inc. $125,918,000 9.150% 01/02/2023 $0 $125,918,000 $125,918,000 AT&T Inc. $250,418,000 Floating 15/02/2023 $0 $250,418,000 $250,418,000 AT&T Inc. $1,890,061,000 3.600% 17/02/2023 $0 $1,890,061,000 $1,890,061,000 AT&T Inc. € 1,250,000,000 2.500% 15/03/2023 $0 $1,421,625,000 $1,421,625,000 AT&T Inc. $500,000,000 (d) Floating 28/04/2023 $0 $500,000,000 $500,000,000 AT&T Inc. € 426,473,000 2.750% 19/05/2023 $0 $485,027,743 $485,027,743 DIRECTV Holdings LLC / DIRECTV Financing Co., Inc. € 73,461,000 2.750% 19/05/2023 $0 $83,547,195 $83,547,195 AT&T Inc. $3,050,000,000 (d) Floating 20/05/2023 $0 $3,050,000,000 $3,050,000,000 AT&T Inc. € 1,250,000,000 1.300% 05/09/2023 $0 $1,421,625,000 $1,421,625,000 AT&T Inc. € 878,507,000 Floating 05/09/2023 $0 $999,126,011 $999,126,011 AT&T Inc. € 450,273,000 1.050% 05/09/2023 $0 $512,095,483 $512,095,483 Time Warner Inc. € 164,028,000 1.950% 15/09/2023 $0 $186,549,044 $186,549,044 AT&T Inc. € 535,591,000 1.950% 15/09/2023 $0 $609,127,644 $609,127,644 AT&T Inc. AUD 475,000,000 3.450% 19/09/2023 $0 $333,450,000 $333,450,000 AT&T Inc. AUD 150,000,000 Floating 19/09/2023 $0 $105,300,000 $105,300,000 Time Warner Inc. $88,713,000 4.050% 15/12/2023 $0 $88,713,000 $88,713,000 AT&T Inc. $411,202,000 4.050% 15/12/2023 $0 $411,202,000 $411,202,000 Historic TW Inc. $49,643,000 7.570% 01/02/2024 $0 $49,643,000 $49,643,000 AT&T Inc. $54,176,000 7.570% 01/02/2024 $0 $54,176,000 $54,176,000 AT&T Inc. $750,000,000 (d) Floating 29/02/2024 $0 $750,000,000 $750,000,000 AT&T Inc. $750,000,000 3.800% 01/03/2024 $0 $750,000,000 $750,000,000 AT&T Inc. $1,000,000,000 3.900% 11/03/2024 $0 $1,000,000,000 $1,000,000,000 AT&T Inc. € 1,600,000,000 2.400% 15/03/2024 $0 $1,819,680,000 $1,819,680,000 AT&T Inc. $1,207,937,000 4.450% 01/04/2024 $0 $1,207,937,000 $1,207,937,000 DIRECTV Holdings LLC / DIRECTV Financing Co., Inc. $42,036,000 4.450% 01/04/2024 $0 $42,036,000 $42,036,000 AT&T Inc. CAD 600,000,000 2.850% 25/05/2024 $0 $458,190,149 $458,190,149 Time Warner Inc. $160,452,000 3.550% 01/06/2024 $0 $160,452,000 $160,452,000 AT&T Inc. $589,458,000 3.550% 01/06/2024 $0 $589,458,000 $589,458,000 AT&T Inc. $3,750,000,000 Floating 12/06/2024 $0 $3,750,000,000 $3,750,000,000 AT&T Inc. $300,000,000 (d) Floating 23/06/2024 $0 $300,000,000 $300,000,000 AT&T Inc. CHF 450,000,000 1.375% 04/12/2024 $0 $460,923,896 $460,923,896 AT&T Inc. $1,161,110,000 3.950% 15/01/2025 $0 $1,161,110,000 $1,161,110,000 DIRECTV Holdings LLC / DIRECTV Financing Co., Inc. $38,659,000 3.950% 15/01/2025 $0 $38,659,000 $38,659,000 AT&T Inc. $5,000,000,000 3.400% 15/05/2025 $0 $5,000,000,000 $5,000,000,000 Time Warner Inc. $170,004,000 3.600% 15/07/2025 $0 $170,004,000 $170,004,000 AT&T Inc. $1,329,934,000 3.600% 15/07/2025 $0 $1,329,934,000 $1,329,934,000 BellSouth Telecommunications, Inc. $105,567,000 7.000% 01/10/2025 $0 $105,567,000 $105,567,000 AT&T Inc. $55,006,000 7.000% 01/10/2025 $0 $55,006,000 $55,006,000 AT&T Inc. CAD 1,250,000,000 4.000% 25/11/2025 $0 $954,562,810 $954,562,810 AT&T Inc. € 1,000,000,000 3.500% 17/12/2025 $0 $1,137,300,000 $1,137,300,000 Historic TW Inc. $16,568,000 6.850% 15/01/2026 $0 $16,568,000 $16,568,000 Time Warner Inc. $58,841,000 3.875% 15/01/2026 $0 $58,841,000 $58,841,000 AT&T Inc. $541,141,000 3.875% 15/01/2026 $0 $541,141,000 $541,141,000 AT&T Inc. AUD 300,000,000 4.100% 19/01/2026 $0 $210,600,000 $210,600,000 AT&T Inc. $2,650,000,000 4.125% 17/02/2026 $0 $2,650,000,000 $2,650,000,000 Pacific Bell $279,817,000 7.125% 15/03/2026 $0 $279,817,000 $279,817,000 AT&T Inc. $257,200,000 7.125% 15/03/2026 $0 $257,200,000 $257,200,000 Time Warner Inc. $92,725,000 2.950% 15/07/2026 $0 $92,725,000 $92,725,000 AT&T Inc. $707,258,000 2.950% 15/07/2026 $0 $707,258,000 $707,258,000 AT&T Inc. $1,323,529,412 (d) 2.270% 10/08/2026 $176,470,588 $1,147,058,824 $1,323,529,412 Indiana Bell Telephone Company, Incorporated $28,063,000 7.300% 15/08/2026 $0 $28,063,000 $28,063,000 AT&T Inc. $21,270,000 7.300% 15/08/2026 $0 $21,270,000 $21,270,000 AT&T Inc. € 1,489,219,000 1.800% 05/09/2026 $0 $1,693,688,769 $1,693,688,769 BellSouth Capital Funding Corporation $4,295,000 6.040% 15/11/2026 $0 $4,295,000 $4,295,000 Wisconsin Bell, Inc. $60,000 6.350% 01/12/2026 $0 $60,000 $60,000 AT&T Inc. £ 750,000,000 2.900% 04/12/2026 $0 $952,200,000 $952,200,000 Time Warner Inc. $170,784,000 3.800% 15/02/2027 $0 $170,784,000 $170,784,000 AT&T Inc. $1,329,194,000 3.800% 15/02/2027 $0 $1,329,194,000 $1,329,194,000 AT&T Inc. $2,000,000,000 4.250% 01/03/2027 $0 $2,000,000,000 $2,000,000,000 AT&T Inc. £ 600,000,000 5.500% 15/03/2027 $0 $761,760,000 $761,760,000 AT&T Inc. $1,250,000,000 (d) 3.380% 31/08/2027 $147,058,824 $1,102,941,176 $1,250,000,000 Ameritech Capital Funding Corporation $43,380,000 6.875% 15/10/2027 $0 $43,380,000 $43,380,000 AT&T Inc. $11,000,000 6.875% 15/10/2027 $0 $11,000,000 $11,000,000 Ameritech Capital Funding Corporation $104,205,000 6.550% 15/01/2028 $0 $104,205,000 $104,205,000 Historic TW Inc. $82,846,000 6.950% 15/01/2028 $0 $82,846,000 $82,846,000 AT&T Inc. $114,586,000 6.550% 15/01/2028 $0 $114,586,000 $114,586,000 AT&T Inc. $43,801,000 6.950% 15/01/2028 $0 $43,801,000 $43,801,000 AT&T Inc. $2,449,011,000 4.100% 15/02/2028 $0 $2,449,011,000 $2,449,011,000 BellSouth Telecommunications, Inc. $215,798,000 6.375% 01/06/2028 $0 $215,798,000 $215,798,000 AT&T Inc. $95,418,000 6.375% 01/06/2028 $0 $95,418,000 $95,418,000 AT&T Inc. AUD 400,000,000 4.600% 19/09/2028 $0 $280,800,000 $280,800,000 AT&T Inc. $3,000,000,000 4.350% 01/03/2029 $0 $3,000,000,000 $3,000,000,000 AT&T Corp. $120,939,000 6.500% 15/03/2029 $0 $120,939,000 $120,939,000 AT&T Inc. $6,820,000 6.500% 15/03/2029 $0 $6,820,000 $6,820,000 Historic TW Inc. $96,296,000 6.625% 15/05/2029 $0 $96,296,000 $96,296,000 AT&T Inc. $190,040,000 6.625% 15/05/2029 $0 $190,040,000 $190,040,000 AT&T Inc. € 1,260,469,000 2.350% 05/09/2029 $0 $1,433,531,394 $1,433,531,394 AT&T Inc. £ 745,000,000 4.375% 14/09/2029 $0 $945,852,000 $945,852,000 DIRECTV Holdings LLC / DIRECTV Financing Co., Inc. £ 4,940,000 4.375% 14/09/2029 $0 $6,271,824 $6,271,824 AT&T Inc. € 800,000,000 2.600% 17/12/2029 $0 $909,840,000 $909,840,000 BellSouth Capital Funding Corporation $121,479,000 7.875% 15/02/2030 $0 $121,479,000 $121,479,000 AT&T Inc. $3,156,272,000 4.300% 15/02/2030 $0 $3,156,272,000 $3,156,272,000 AT&T Inc. $201,852,000 7.875% 15/02/2030 $0 $201,852,000 $201,852,000 AT&T Inc. CHF 150,000,000 1.875% 04/12/2030 $0 $153,641,299 $153,641,299 AT&T Wireless Services, Inc. $348,622,000 8.750% 01/03/2031 $0 $348,622,000 $348,622,000 AT&T Inc. $216,393,000 8.750% 01/03/2031 $0 $216,393,000 $216,393,000 Time Warner Inc. $194,243,000 7.625% 15/04/2031 $0 $194,243,000 $194,243,000 AT&T Inc. $187,707,000 7.625% 15/04/2031 $0 $187,707,000 $187,707,000 BellSouth Corporation $125,832,000 6.875% 15/10/2031 $0 $125,832,000 $125,832,000 AT&T Inc. $169,287,000 6.875% 15/10/2031 $0 $169,287,000 $169,287,000 AT&T Corp. $168,465,000 8.750% 15/11/2031 $0 $168,465,000 $168,465,000 AT&T Inc. $217,786,000 8.250% 15/11/2031 $0 $217,786,000 $217,786,000 Cingular Wireless LLC $195,000,000 7.125% 15/12/2031 $0 $195,000,000 $195,000,000 AT&T Inc. $148,730,000 7.125% 15/12/2031 $0 $148,730,000 $148,730,000 Time Warner Inc. $153,445,000 7.700% 01/05/2032 $0 $153,445,000 $153,445,000 AT&T Inc. $156,925,000 7.700% 01/05/2032 $0 $156,925,000 $156,925,000 AT&T Inc. € 1,400,000,000 3.550% 17/12/2032 $0 $1,592,220,000 $1,592,220,000 AT&T Inc. £ 342,361,000 5.200% 18/11/2033 $0 $434,661,526 $434,661,526 DIRECTV Holdings LLC / DIRECTV Financing Co., Inc. £ 7,599,000 5.200% 18/11/2033 $0 $9,647,690 $9,647,690 AT&T Inc. € 500,000,000 3.375% 15/03/2034 $0 $568,650,000 $568,650,000 BellSouth Corporation $157,011,000 6.550% 15/06/2034 $0 $157,011,000 $157,011,000 AT&T Inc. $252,536,000 6.450% 15/06/2034 $0 $252,536,000 $252,536,000 AT&T Inc. $143,801,000 6.550% 15/06/2034 $0 $143,801,000 $143,801,000 AT&T Inc. $356,075,000 6.150% 15/09/2034 $0 $356,075,000 $356,075,000 BellSouth Corporation $227,344,000 6.000% 15/11/2034 $0 $227,344,000 $227,344,000 AT&T Inc. $71,388,000 6.000% 15/11/2034 $0 $71,388,000 $71,388,000 AT&T Inc. € 1,250,000,000 2.450% 15/03/2035 $0 $1,421,625,000 $1,421,625,000 AT&T Inc. $2,500,000,000 4.500% 15/05/2035 $0 $2,500,000,000 $2,500,000,000 Historic TW Inc. $157,766,000 8.300% 15/01/2036 $0 $157,766,000 $157,766,000 AT&T Inc. $128,330,000 6.800% 15/05/2036 $0 $128,330,000 $128,330,000 AT&T Inc. € 1,750,000,000 3.150% 04/09/2036 $0 $1,990,275,000 $1,990,275,000 Time Warner Inc. $90,652,000 6.500% 15/11/2036 $0 $90,652,000 $90,652,000 AT&T Inc. $160,252,000 6.500% 15/11/2036 $0 $160,252,000 $160,252,000 AT&T Inc. $3,000,000,000 5.250% 01/03/2037 $0 $3,000,000,000 $3,000,000,000 AT&T Inc. $1,278,679,000 4.900% 15/08/2037 $0 $1,278,679,000 $1,278,679,000 AT&T Inc. $412,098,000 6.500% 01/09/2037 $0 $412,098,000 $412,098,000 Ameritech Capital Funding Corporation $3,549,000 5.950% 15/01/2038 $0 $3,549,000 $3,549,000 AT&T Inc. $849,360,000 6.300% 15/01/2038 $0 $849,360,000 $849,360,000 AT&T Inc. $8,040,000 5.950% 15/01/2038 $0 $8,040,000 $8,040,000 AT&T Inc. $229,036,000 6.400% 15/05/2038 $0 $229,036,000 $229,036,000 AT&T Inc. $510,063,000 6.550% 15/02/2039 $0 $510,063,000 $510,063,000 AT&T Inc. $2,000,000,000 4.850% 01/03/2039 $0 $2,000,000,000 $2,000,000,000 AT&T Inc. $490,483,000 6.350% 15/03/2040 $0 $490,483,000 $490,483,000 Time Warner Inc. $27,389,000 6.200% 15/03/2040 $0 $27,389,000 $27,389,000 DIRECTV Holdings LLC / DIRECTV Financing Co., Inc. $9,517,000 6.350% 15/03/2040 $0 $9,517,000 $9,517,000 AT&T Inc. $329,267,000 6.200% 15/03/2040 $0 $329,267,000 $329,267,000 AT&T Inc. £ 1,100,000,000 7.000% 30/04/2040 $0 $1,396,560,000 $1,396,560,000 Time Warner Inc. $66,554,000 6.100% 15/07/2040 $0 $66,554,000 $66,554,000 AT&T Inc. $392,704,000 6.100% 15/07/2040 $0 $392,704,000 $392,704,000 AT&T Inc. $1,234,030,000 6.000% 15/08/2040 $0 $1,234,030,000 $1,234,030,000 DIRECTV Holdings LLC / DIRECTV Financing Co., Inc. $15,947,000 6.000% 15/08/2040 $0 $15,947,000 $15,947,000 AT&T Inc. $1,789,560,000 5.350% 01/09/2040 $0 $1,789,560,000 $1,789,560,000 AT&T Inc. $984,108,000 6.375% 01/03/2041 $0 $984,108,000 $984,108,000 DIRECTV Holdings LLC / DIRECTV Financing Co., Inc. $15,874,000 6.375% 01/03/2041 $0 $15,874,000 $15,874,000 Time Warner Inc. $73,554,000 6.250% 29/03/2041 $0 $73,554,000 $73,554,000 AT&T Inc. $521,724,000 6.250% 29/03/2041 $0 $521,724,000 $521,724,000 AT&T Inc. $1,009,543,000 5.550% 15/08/2041 $0 $1,009,543,000 $1,009,543,000 Time Warner Inc. $52,683,000 5.375% 15/10/2041 $0 $52,683,000 $52,683,000 AT&T Inc. $447,305,000 5.375% 15/10/2041 $0 $447,305,000 $447,305,000 AT&T Inc. $1,208,505,000 5.150% 15/03/2042 $0 $1,208,505,000 $1,208,505,000 DIRECTV Holdings LLC / DIRECTV Financing Co., Inc. $41,433,000 5.150% 15/03/2042 $0 $41,433,000 $41,433,000 Time Warner Inc. $105,500,000 4.900% 15/06/2042 $0 $105,500,000 $105,500,000 AT&T Inc. $394,320,000 4.900% 15/06/2042 $0 $394,320,000 $394,320,000 AT&T Inc. $1,956,149,000 4.300% 15/12/2042 $0 $1,956,149,000 $1,956,149,000 AT&T Inc. £ 1,000,000,000 4.250% 01/06/2043 $0 $1,269,600,000 $1,269,600,000 Time Warner Inc. $63,661,000 5.350% 15/12/2043 $0 $63,661,000 $63,661,000 AT&T Inc. $436,339,000 5.350% 15/12/2043 $0 $436,339,000 $436,339,000 AT&T Inc. £ 1,250,000,000 4.875% 01/06/2044 $0 $1,587,000,000 $1,587,000,000 Time Warner Inc. $129,343,000 4.650% 01/06/2044 $0 $129,343,000 $129,343,000 AT&T Inc. $470,656,000 4.650% 01/06/2044 $0 $470,656,000 $470,656,000 AT&T Inc. $2,500,000,000 4.800% 15/06/2044 $0 $2,500,000,000 $2,500,000,000 AT&T Inc. $1,295,000,000 4.700% 10/11/2044 $0 $1,295,000,000 $1,295,000,000 AT&T Inc. $2,619,000,000 4.600% 12/02/2045 $0 $2,619,000,000 $2,619,000,000 AT&T Inc. $3,043,850,000 4.350% 15/06/2045 $0 $3,043,850,000 $3,043,850,000 Time Warner Inc. $104,314,000 4.850% 15/07/2045 $0 $104,314,000 $104,314,000 AT&T Inc. $795,686,000 4.850% 15/07/2045 $0 $795,686,000 $795,686,000 BellSouth Telecommunications, Inc. $52,482,000 5.850% 15/11/2045 $0 $52,482,000 $52,482,000 AT&T Inc. $379,000 5.850% 15/11/2045 $0 $379,000 $379,000 AT&T Inc. $3,500,000,000 4.750% 15/05/2046 $0 $3,500,000,000 $3,500,000,000 AT&T Inc. $1,750,725,000 5.150% 15/11/2046 $0 $1,750,725,000 $1,750,725,000 AT&T Inc. $1,500,000,000 5.650% 15/02/2047 $0 $1,500,000,000 $1,500,000,000 AT&T Inc. $2,000,000,000 5.450% 01/03/2047 $0 $2,000,000,000 $2,000,000,000 AT&T Inc. CAD 750,000,000 4.850% 25/05/2047 $0 $572,737,686 $572,737,686 AT&T Inc. $1,430,000,000 5.500% 15/06/2047 $0 $1,430,000,000 $1,430,000,000 AT&T Inc. $4,499,999,000 4.500% 09/03/2048 $0 $4,499,999,000 $4,499,999,000 AT&T Inc. CAD 750,000,000 5.100% 25/11/2048 $0 $572,737,686 $572,737,686 AT&T Inc. $2,500,000,000 4.550% 09/03/2049 $0 $2,500,000,000 $2,500,000,000 AT&T Inc. $1,694,666,000 5.150% 15/02/2050 $0 $1,694,666,000 $1,694,666,000 AT&T Inc. $1,000,000,000 5.700% 01/03/2057 $0 $1,000,000,000 $1,000,000,000 AT&T Inc. $643,744,000 5.300% 15/08/2058 $0 $643,744,000 $643,744,000 AT&T Inc. $1,322,500,000 5.350% 01/11/2066 $0 $1,322,500,000 $1,322,500,000 AT&T Inc. $825,000,000 5.625% 01/08/2067 $0 $825,000,000 $825,000,000 BellSouth Telecommunications, Inc. $77,270,000 7.000% 01/12/2095 $0 $77,270,000 $77,270,000 AT&T Inc. $45,534,000 7.000% 01/12/2095 $0 $45,534,000 $45,534,000 BellSouth Telecommunications, Inc. $41,584,000 6.650% 15/12/2095 $0 $41,584,000 $41,584,000 AT&T Inc. $32,050,000 6.650% 15/12/2095 $0 $32,050,000 $32,050,000 BellSouth Capital Funding Corporation $89,932,000 7.120% 15/07/2097 $0 $89,932,000 $89,932,000 AT&T Inc. $85,856,000 7.120% 15/07/2097 $0 $85,856,000 $85,856,000 $9,466,728,887 $159,354,463,658 $168,821,192,545 $3,163,873,226 – $3,163,873,226 $3,992,932 – $3,992,932 $137,209,253 $1,808,744,696 $1,945,953,949 – $26,725,736 $26,725,736 ($465,509,331) ($465,509,331) – ($2,939,413,217) ($2,939,413,217) – $4,850,973 $4,850,973 $12,771,804,299 (e) $157,789,862,515 (f) $170,561,666,814 Putable annually in April. Putable annually in May. Includes credit agreements at Mexico and DTV Latin America subsidiaries Credit agreement / Term loan facility; Maturity date represents final maturity Amount shown as debt maturing within one year on AT&T’s consolidated balance sheet. Amount shown as long-term debt on AT&T’s consolidated balance sheet.
Prudential is one of the UK’s premier life insurance companies, and investment management firms.
www.prudential.co.uk
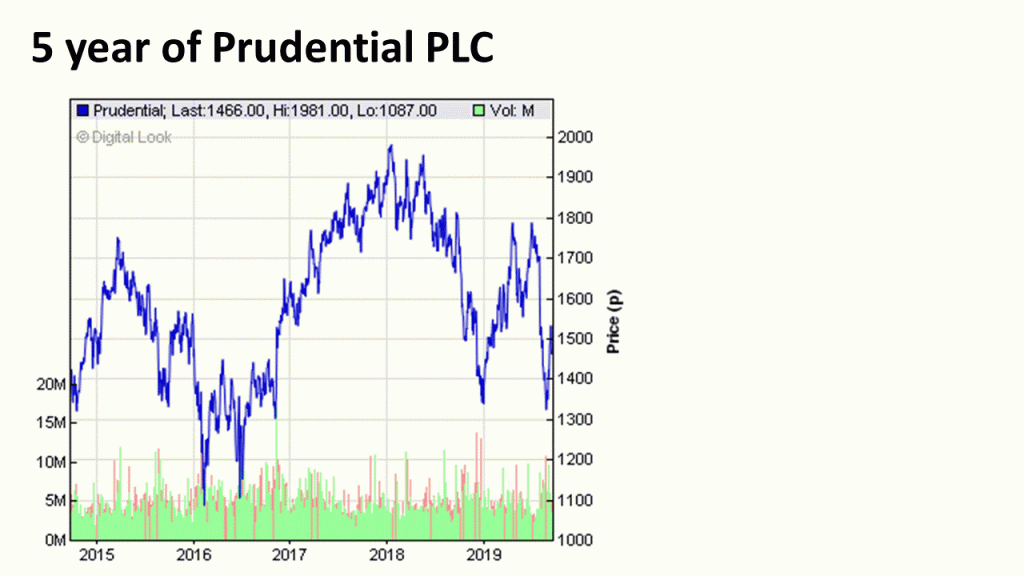
And back in the spring of 1720, Sir Isaac Newton owned shares in the South Sea Company, the hottest stock in England. Sensing that the market was getting out of hand, the great physicist muttered that he “could calculate the motions of the heavenly bodies, but not the madness of the people.” Newton dumped his South Sea shares, pocketing a 100% profit totaling £7,000. But just months later, swept up in the wild enthusiasm of the market, Newton jumped back in at a much higher price—and lost £20,000 (or more than $3 million in today’s money). For the rest of his life, he forbade anyone to speak the words “South Sea” in his presence
Legal & General UCITS ETF Public Limited Company L&G ISE Cyber Security Go Ucits ETF
Look a the performance:-
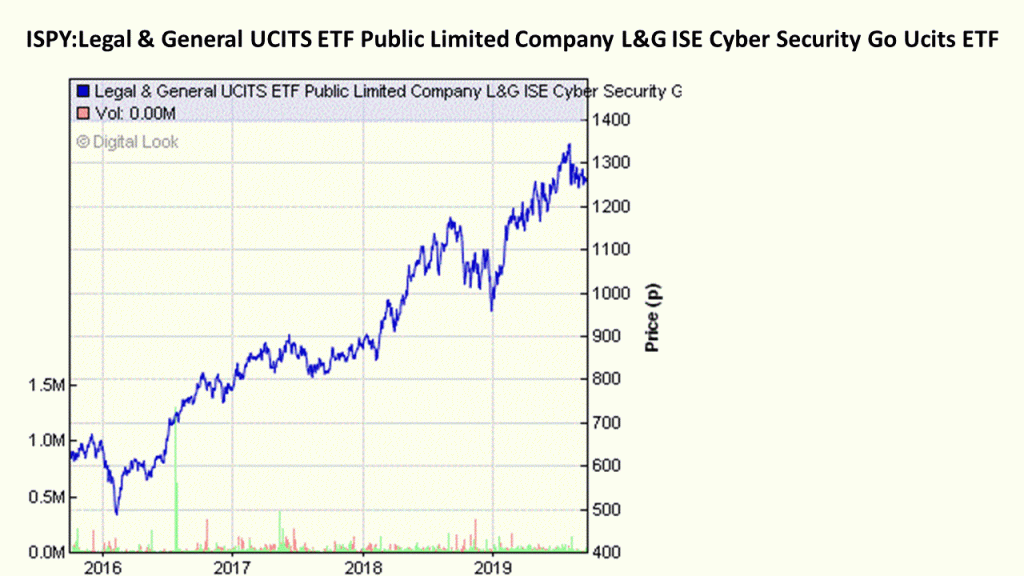
Yesterday, HICL the London listed infrastructure company paid it’s quarterly dividend.
2.06p a share.
The total issued share capital with voting rights is 1,791,142,767
https://www.londonstockexchange.com/exchange/news/market-news/market-news-detail/HICL/14013053.html
Thus:- 1,791,142,767 x £0.0206 = £36,897,541.0002
That is £36m.
The United States hold a strategic reserve of oil.
https://www.energy.gov/fe/services/petroleum-reserves/strategic-petroleum-reserve/spr-storage-sites
America began setting aside emergency reserves of crude oil, the largest in the world, after the 1973 oil embargo by Arab members of the Organization of Petroleum Exporting Countries, or OPEC, triggered an oil crisis and sent the U.S. economy into recession. President Gerald Ford signed legislation in 1975 to establish a strategic reserve that would hold up to 1 billion barrels of oil to mitigate the damage from any future shortages in global supply. The Strategic Petroleum Reserve currently has about 645 million barrels of crude stored deep across four underground caverns created in salt domes along the Texas and Louisiana Gulf Coasts. Maintained by the Department of Energy, the caverns can hold up to 727 million barrels of crude. The stockpile is sufficient to cover “the equivalent of 143 days of import protection.”
What is the value of this crude ?
Today, crude trades are $68.78 a barrel.
So, what is the value of the current inventory of the US Strategic Petroleum Reserve ?
$68.78 a barrel x 645,000,000 = $44,363,100,000
That is $44bn.
Yesterday, Standard Life Aberdeen, paid out its September dividend.
7.3p a share.
https://www.londonstockexchange.com/exchange/news/market-news/market-news-detail/SLA/14172142.html
The total number of voting rights in the Company, as at 31 July 2019, is 2,409,829,466
Thus:
2,409,829,466 x £0.073 = £175,917,551.018
That is £175m.
Today, Royal Dutch Shell pays out its September dividend.
It pays out:-
RDSA Royal Dutch Shell A $0.47 (38.01p) a share
RDSB Royal Dutch Shell B $0.47 (38.01p) a share
Royal Dutch Shell plc´s capital as at 3 September 2019 consists of 4,272,923,983 A shares and 3,735,785,448 B shares, each with equal voting rights. Royal Dutch Shell plc holds no ordinary shares in Treasury. The total number of A shares and B shares in issue as at 3 September 2019 is 8,008,709,431
https://www.londonstockexchange.com/exchange/news/market-news/market-news-detail/RDSA/14212523.html
Thus: 8,008,709,431 x £0.3801 = £3,044,110,454.7231
That is £3,044 Million = £3.044 Billion.
A yield of over 6.3%
Tomorrow,, Friday 20th Sept, BP pay’s out its September dividend.
$0.1025 (8.3475p) a share.
The total number of voting rights in BP p.l.c. is 20,376,656,701
https://www.londonstockexchange.com/exchange/news/market-news/market-news-detail/BP./14208936.html
Thus:- 20,376,656,701 x £0.083475 = £1,700,941,418.115975
That is £1,700 million = £1.7 billion
6.38% yield.
The Legal & General UK Smaller Companies Trust is a £289m unit trust.
The fund objective is to provide growth above that of the Numis ex-Investment Trusts Index Net TR, the “Benchmark Index”. The Fund aims to outperform the Benchmark Index by 3% per annum. This objective is before the deduction of any charges and measured over rolling three year periods.
Its top ten holdings are:-
Safestore Holdings 3.5% of the fund
Genus 3.4% of the fund
Discoverie Group 3.3% of the fund
Energean Oil & Gas 3.1% of the fund
Dechra Pharmaceuticals 3.0% of the fund
Cranswick 2.7% of the fund
Euromoney Institutional Investor 2.5% of the fund
ITE Group 2.4% of the fund Workspace Group 2.3% of the fund
Ultra Electronics Holdings 2.3% of the fund
Today, Lloyds Banking Group pays out its September dividend.
1.12p a share
https://www.londonstockexchange.com/exchange/news/market-news/market-news-detail/LLOY/14208524.html
The total number of shares issued by Lloyds Banking Group plc with rights to vote which are exercisable in all circumstances at general meetings is 70,128,674,524 ordinary shares of 10p each
Thus: 70,128,674,524 x £0.012 = £841,544,094.288
That is £841 Million.
6% yield.
Today, the world’s leading TV and Telecoms company pays out its September dividend.
http://www.bt.com
10.78p a share.
The total number of voting rights in BT Group plc on that date was 9,882,151,936
https://www.londonstockexchange.com/exchange/news/market-news/market-news-detail/BT.A/14208476.html
Thus:- 9,882,151,936 x £0.1078 = £1,065,295,978.7008
That is £1,065 Million.
That is £1.065 Billion.
The objective of this fund is to provide a combination of income and capital growth and to keep the fund within a pre-determined risk profile. While this will be the fund’s focus, it will have a bias towards investments that pay a higher income. At least 75% of the fund will be invested in other authorised investment funds. The fund will invest at least 50% in index-tracker funds which are operated by Legal & General.
TOP 10 HOLDINGS (%)
L&G UK Index Trust 8.2% of the fund
L&G Emerging Markets Government Bond (Local Currency) Index Fund 8.0% of the fund
iShares UK Dividend UCITS ETF 8.0% of the fund
L&G Emerging Markets Government Bond (US$)
Index Fund 7.4% of the fund
LGIM Global Corporate Bond Fund 6.6% of the fund
L&G High Income Trust 5.8% of the fund
L&G European Index Trust 5.2% of the fund
L&G US Index Trust 5.0% of the fund
L&G Managed Monthly Income Trust 4.7% of the fund
L&G UK Property Fund 4.7% of the fund
Another month, guess what, take a lucky guess, it is the same old story, HM Government, spends more money than it receives via taxes and duties. Another deficit month, thus to bridge the gap, needs to borrow on the bond market
In August 2019 , the HM Government had to borrow money to meet the difference between tax revenues and public sector expenditure. The term for this is The PSNCR: The Public Sector Net Cash Requirement. There were “only” 3 auctions of Gilts (UK Government Bonds) by the UK Debt Management Office to raise cash for HM Treasury:-
06-Aug-2019 0 5/8% Treasury Gilt 2025 3,000.0000 Million
13-Aug-2019 1¾% Treasury Gilt 2049 2,299.9970 Million
20-Aug-2019 0 1/8% Index-linked Treasury Gilt 2028 3 months 1,264.9970 Million
When you add the cash raised:- 3,000.0000 Million + 2,299.9970 Million + 1,264.9970 Million = £6564.994 Million
£6564.994 Million = £6.564994 Billion
On another way of looking at it, is in the 31 days in August, HM Government borrowed:- £211.774 Million each day for the 31 days.
We are fortunate, while the global banking and financial markets still has the confidence in HM Government to buy the Gilts (Lend money to the UK), the budget deficit keeps rising. What is also alarming, is the dates these bond mature 2025, 2028 and 2049 All long term borrowings, we are mortgaging our futures, but at least “We Are In It Together….”
I think that the feeling that some people feel when listening to this song comes from the fact that the song has some reminiscence of the nostalgia that hurts the most, the one of what could have been, but never was. And in this case it was “complicated” for something to happen, it was better to leave the key and go and think what could have happened. I think the song brings us something of the perfume of our own youth and what we could have done and everything that happened, that’s why a knot forms in our stomach, because we realise the finitude of our own life
Hey little girl, is your daddy home?
Did he go away and leave you all alone?
Mhmm
I got a bad desire
Oh oh oh,
I’m on fire
Tell me now, baby, is he good to you?
And can he do to you the things that I do?
Oh no
I can take you higher
Oh oh oh,
I’m on fire
Sometimes it’s like someone took a knife,
baby Edgy and dull and cut a six inch valley Through the middle of my skull
At night I wake up with the sheets soaking wet
And a freight train running through the middle of my head
Only you can cool my desire
Oh oh oh, I’m on fire Oh oh oh, I’m on fire Oh oh oh, I’m on fire Woo ooh ooh Woo ooh ooh Ooh ooh ooh Woo ooh ooh Woo ooh ooh
The hardest thing in the world to understand is the income tax. Albert Einstein – coolfunnyquotes.com
Another month, guess what, take a lucky guess, it is the same old story, HM Government, spends more money than it receives via taxes and duties.
Another deficit month, thus to bridge the gap, needs to borrow on the bond market In July 2019 , the HM Government had to borrow money to meet the difference between tax revenues and public sector expenditure. The term for this is The PSNCR: The Public Sector Net Cash Requirement. There were “only” 3 auctions of Gilts (UK Government Bonds) by the UK Debt Management Office to raise cash for HM Treasury:-
02-Jul-2019 0 5/8% Treasury Gilt 2025 3,373.0970 Million
16-Jul-2019 1¾% Treasury Gilt 2037 2,250.0000 Million
23-Jul-2019 0 7/8% Treasury Gilt 2029 3,162.4970 Million
When you add the cash raised:- 3,373.0970 Million + 2,250.0000 Million + 3,162.4970 Million = £8785.594 Million
£8785.594 Million = £8.785594 Billion
On another way of looking at it, is in the 31 days in July, HM Government borrowed:- £283.40625806451612903225806451613 Million each day for the 31 days. We are fortunate, while the global banking and financial markets still has the confidence in HM Government to buy the Gilts (Lend money to the UK), the budget deficit keeps rising. What is also alarming, is the dates these bond mature 2025, 2029 and 2037 All long term borrowings, we are mortgaging our futures, but at least “We Are In It Together….”
The objective of this fund is to provide a combination of income and capital growth and to keep the fund within a pre-determined risk profile. While this will be the fund’s focus, it will have a bias towards investments that pay a higher income. At least 75% of the fund will be invested in other authorised investment funds. The fund will invest at least 50% in index-tracker funds which are operated by Legal & General.
It is spread across 5 asset classes:-
Government Bonds 2.1% of the fund
Equities 58.4% of the fund
Cash 0.3% of the fund
Credit and Emerging Market Debt 29.6% of the fund
Alternatives 9.6% of the fund
The TOP 10 HOLDINGS (%)
L&G UK Index Trust 9.9% of the fund
L&G Emerging Markets Government Bond (Local Currency) Index Fund 7.9% of the fund
iShares UK Dividend UCITS ETF 7.5% of the fund
L&G Emerging Markets Government Bond (US$) Index Fund 7.4% of the fund
L&G US Index Trust 7.0% of the fund
L&G Pacific Index Trust 6.4% of the fund
L&G High Income Trust 6.2% of the fund
L&G European Index Trust 5.9% of the fund
LGIM Global Corporate Bond Fund 5.0% of the fund
L&G UK Property Fund 4.4% of the fund
On Friday 2nd August, Vodafone plc paid out its August dividend.
€0.0416 a share = 3.725072p
The total number of voting rights in Vodafone is 26,767,415,647
https://www.londonstockexchange.com/exchange/news/market-news/market-news-detail/VOD/14172525.html
26,767,415,647 x £0.03725072 = £997,105,505.39001584
That is £997m.
A yield of over 4%
On August 1st 2019, United Utilities paid out its August dividend.
£0.2752 a share.
https://www.unitedutilities.com/
What was the cost of the dividend ?
United Utilities as 681,888,000 shares in circulation:-
681,888,000 x £0.2752 = £187,655,577.6
That is £187m
4% yield.
The Legal and General Multi Manager Income Trust is a Unit Trust that invests in other funds.
It holds:-
Equities 46.6% of the fund
Credit and Emerging Market Debt 26.6% of the fund
Alternatives 16.8% of the fund
Government Bonds 9.4% of the fund
Cash 0.7% of the fund
The fund investment objective is to achieve a high income with some potential for capital growth. The fund will invest in a wide range of investment funds (including funds which are not authorised for sale in the UK) that hold company shares, bonds issued by companies and governments, commercial property and cash. The fund manager will select investment funds that invest across all countries, currencies and sectors.
TOP 10 HOLDINGS (%):-
LGIM Sterling Liquidity Fund 9.1% of the fund
Nordea 1 Global High Yield Bond Fund 8.6% of the fund
Schroder Recovery Fund 8.4% of the fund
Neuberger Berman Global Bond ARB 6.8% of the fund
Artemis Income Fund 5.7% of the fund
MI TwentyFour AM Dynamic Bond Fund 4.9% of the fund
BlackRock Emerging Markets Loc Curr 4.1% of the fund
Legg Mason Gbl Fd Wstn Asset Stru Opp Prem Cl 4.0% of the fund
Man GLG Continental European Growth 3.8% of the fund
If you owe the bank £100 that’s your problem. If you owe the bank £100 million, that’s the bank’s problem
Today, UK Mortgages PLC pays out its dividend. 1.125p a share
Now UKML has 273,000,000 shares in issue:
https://mma.prnewswire.com/media/950076/UKML_Factsheet___May_2019.pdf
Thus:- 273,000,000 x £0.01125 = £3,071,250
£3 million, a yield of 8.3%
The L&G Pharma Breakthrough UCITS ETF is an Exchange Traded Fund that owns shares in pharmaceutical companies, that looks for Long-term value in the pharmaceutical sub-sector that benefits from certain commercial and regulatory incentives.
It’s top ten holdings are:-
Array BioPharma 6.6% of the fund
PTC Therapeutics 4.2% of the fund
PharmaMar 4.0% of the fund
Grifols 3.7% of the fund
CSL 3.6% of the fund
Nippon Shinyaku 3.6% of the fund
Celgene 3.6% of the fund
Jazz Pharmaceuticals 3.4% of the fund
Novartis 3.3% of the fund
Ipsen 3.3% of the fund
https://www.shareshop.hsbc.co.uk/shareshop/security.cgi?csi=54634586&action=
Anheuser-Busch InBev is one of the largest drinks and brewing companies in the world.
The annual report makes interesting reading.
The debt mountain, could drive a sober person to drink. Debt Interest-bearing loans and borrowings $105,584 Million. That is $105 Billion. Interest payments (finance costs) known as “Interest expense” $4.141 Billion.
The Company aims to generate a regular and attractive level of income with low asset value volatility by investing in a diversified portfolio of public and private debt and debt-like instruments (‘Debt Instruments’), of which at least 70% will be investment grade
http://docs.mandg.com/MR/MandG_Credit-Income-Investment-Trust_Factsheet_GB_eng.pdf
Top 20 holdings:-
M&G European Loan Fund 8.41% of the fund
Cash 7.80% of the fund
HSBC Holdings Plc 1.92% of the fund
Project Gate 1.82% of the fund
Brass No 6 Plc Brass 6 1.76% of the fund
Warwick Finance Residential Mortgages No. One Plc Warw 1 1.53% of the fund
Silverstone Master Issuer Smi 18-1x 1.51% of the fund
Newday Partnership Funding Plc Ndpft 17-1 1.51% of the fund
Coventry Building Society 1.48% of the fund
Marstons Issuer Plc 1.38% of the fund
Castell Caste 18-1 1.34% of the fund
Charter Mortgage Funding CCMF 18-1 1.34% of the fund
Yorkshire Building Society 1.24% of the fund
Altice Luxembourg SA 1.22% of the fund
Paragon Mortgages Plc Pargn 25 1.20% of the fund
Imperial Brands Finance Plc 1.19% of the fund
Lloyds Banking Group Plc 1.19% of the fund
Sonovate Limited 1.17% of the fund
London and Quadrant Housing Trust Ltd 1.17% of the fund
Hammerson Plc 1.17% of the fund
Marks and Spencer PLC funding strategy is to ensure a mix of funding sources offering flexibility and cost effectiveness to match the requirements of the Group. Operating subsidiaries are financed by a combination of retained profits, bank borrowings, medium term notes, finance leases and committed bank facilities
Marks and Spencer has issued Medium Term Notes (MTN) as follows:
2019 £400m 6.125% Annually
2021 £300m 6.125% Annually
2023 £300m 3.000% Annually
2025 £400m 4.750% Annually
2037 US$300m (circa £240m) 7.125% Semi-annually
total debt (£400m + £300m + £300m + £400m + £240m) = £1,640m = £1.64bn
The national debt of the United States is the total debt, or unpaid borrowed funds, carried by the Federal Government of the United States As of June 2019, federal debt held by the public was $16.17 trillion and intragovernmental holdings were $5.86 trillion, for a total national debt of $22.03 trillion. intragovernmental holdings are primarily composed of the Medicare bills.
The UK national debt is the total amount of money the British government owes to the private sector and other purchasers of UK gilts.
In May 2019, UK public sector net debt was £1,806.1 billion equivalent to 82.9% of GDP
Yesterday 3i Infrastructure pays out it July dividend, Mon 8th July.
4.325p a share.
3i Infrastructure has 810,434,010 issued ordinary shares with voting rights.
https://www.londonstockexchange.com/exchange/news/market-news/market-news-detail/3IN/13586889.html
Thus: 810,434,010 x 4.325p = £35,051,270.9325 That is £35m
On Friday 5th July, HSBC Holdings has paid out its July dividend of US $0.10 = 7.8368p a share.
www.hsbc.com
The total number of voting rights in HSBC Holdings plc is 20,237,155,864.
https://www.londonstockexchange.com/exchange/news/market-news/market-news-detail/HSBA/14129876.html
Thus: 20,237,155,864 x 7.8368p a share = £1,585,945,430.749952
That is £1.585945 Billion
A yield of 5.27%
Another month, guess what, take a lucky guess, it is the same old story, HM Government, spends more money than it receives via taxes and duties. Another deficit month, thus to bridge the gap, needs to borrow on the bond market.
In June 2019 , the HM Government had to borrow money to meet the difference between tax revenues and public sector expenditure. The term for this is The PSNCR: The Public Sector Net Cash Requirement. There were “only” 5 auctions of Gilts (UK Government Bonds) by the UK Debt Management Office to raise cash for HM Treasury:-
02-Jul-2019 0 5/8% Treasury Gilt 2025 £3,373.0970 Million
25-Jun-2019 1¾% Treasury Gilt 2049 £2,250.0000 Million
18-Jun-2019 0 7/8% Treasury Gilt 2029 £5,912.4990 Million
12-Jun-2019 0 1/8% Index-linked Treasury Gilt 2048 3 months £700.0000 Million
04-Jun-2019 1% Treasury Gilt 2024 £3,000.0000 Million
When you add the cash raised:-
(£3,373.0970 Million + £2,250.0000 Million + £5,912.4990 Million + £700.0000 Million + £3,000.0000 Million) = £15,235.596 Million
£15,235.596 Million = £15.235596 Billion
On another way of looking at it, is in the 30 days in June, HM Government borrowed:- £507.8532 Million each day for the 30 days.
We are fortunate, while the global banking and financial markets still has the confidence in HM Government to buy the Gilts (Lend money to the UK), the budget deficit keeps rising. What is also alarming, is the dates these bond mature 2024, 2025, 2029, 2048 and 2049. All long term borrowings, we are mortgaging our futures, but at least “We Are In It Together….”
If all the economists were laid end to end, they’d never reach a conclusion
On Monday 24th June this month, Royal Dutch Shell paid out its quarterly dividend.
It was:-
RDSA Royal Dutch Shell A FTSE 100 $0.47 (36.97p)
RDSB Royal Dutch Shell B FTSE 100 $0.47 (36.97p)
https://www.shareshop.hsbc.co.uk/shareshop/security.cgi?csi=133655
https://www.shareshop.hsbc.co.uk/shareshop/security.cgi?csi=133755
Shell has 2 share classes, Shell A and Shell B
https://www.londonstockexchange.com/exchange/news/market-news/market-news-detail/RDSA/14103461.html
Royal Dutch Shell plc´s capital as at 7 June 2019 consists of 4,346,607,523 A shares and 3,745,486,731 B shares, each with equal voting rights
Thus:
4,346,607,523 x £0.3697 = £1,606,940,801.2531
3,745,486,731 x £0.3697 = £1,384,706,444.4507
Total:- £2,991,647,245.7038.
That is £2.991 Billion.
The Aquila European Renewables Income Fund is a London Listed investment trust.
Managed by Aquila Asset Management. It joined the London Stock Exchange on the 5th June.
https://www.londonstockexchange.com/exchange/news/market-news/market-news-detail/AERS/14099233.html
Aquila European Renewables Income Fund objective is to provide investors with a truly diversified portfolio of renewable assets. The fund’s aim is to invest mostly in diversified operating and a limited number of greenfield renewable energy assets, such as hydropower-plants, onshore wind and solar parks across continental Europe & Ireland
https://www.aquila-capital.de/en/alternative-investments/real-assets/infrastructure/
This fund invests in energy projects that are green.
http://www.shareshop.hsbc.co.uk/shareshop/security.cgi?csi=54815984&action=
Today, BP plc pays out it is quarerly dividend.
8.0655p a share.
The total number of voting rights in BP p.l.c. is 20,350,821,343
https://www.londonstockexchange.com/exchange/news/market-news/market-news-detail/BP./14094792.html
Thus:- 20,350,821,343 x £0.080655 = £1,641,395,495.419665
That is £1,641 million = £1.641 Billion.
5.9% yield.
Woodford Patient Capital Trust PLC is a closed-ended investment company. The Company’s principal activity is investment in quoted and unquoted equities of companies incorporated or listed predominantly in the United Kingdom. The Company’s investment objective is to achieve long-term capital growth through investing in a portfolio consisting predominantly of the United Kingdom companies, both quoted and unquoted. The Company is focused on investing in mid and large-capitalization listed, mature companies; early-stage companies, which are typically quoted and unquoted companies. The Company’s portfolio is diversified across various sectors, which include healthcare, financials, industrials, technology, consumer goods and telecommunication industries.
Its top ten holdings are:-
Benevolentai 9.81% of the fund
Oxford Nanopore Tech Ord 8.32% of the fund
Autolus Therapeutics PLC ADR 8.26% of the fund
Crossco (1337) Plc 8.07% of the fund
Proton Partners Int Ltd ORD GBP0.001 7.34% of the fund
IH HLDGS INTL LTD 6.74% of the fund
Immunocore Ltd Series 5.64% of the fund
Oxford Sciences Plc 4.62% of the fund
IH HLDGS INTL LTD 2.97% of the fund
Credit Suisse expects BT’s move away from sports rights ownership to boost free cash flow by up to £200mln by 2023
Credit Suisse has turned positive on BT Group PLC (LON:BT.A), citing a “much increased level of confidence” in the company’s ability to return to sustainable earnings growth from the 2021 financial year. The investment bank raised its recommendation on BT to ‘outperform’ from ‘neutral’ and lifted its target price to 280p from 270p. “The fact that BT trades on a four-year low enterprise value/earnings (EBITDA) adds to our conviction and more than offsets any short-term impact that the recent disappointment on fiscal year 2020 EBITDA guidance may have,” Credit Suisse said. “We are 2% ahead of fiscal 2022 consensus forecast for EBITDA.” Last month, BT reported a 2% drop in adjusted underlying earnings (EBITDA) to £7.39bn and a 1% decrease in adjusted revenue to £23.46bn for the year to March 31, as growth in the consumer business was offset by regulated price reductions in Openreach and declines in the enterprise businesses. For the 2020 financial year, BT expects adjusted EBITDA will fall to £7.2bn-£7.3bn as adjusted revenue falls by another 2%.
Fibre investment to improve revenue and earnings from 2021 BT said it would be focusing on investing in fibre broadband in the coming year. It increased its target for rolling out ‘fibre to the premises’ broadband from 3mln to 4mln homes and businesses by March 2021. Credit Suisse expects BT’s Openreach division will bring fibre to 15mln UK premises by 2025. The bank believes this will drive upgrades to its Openreach line loss forecasts and improve BT group revenue and EBITDA growth trends from fiscal year 2021. “Our revenue forecasts rise by 0-2% for full years 2020-22 on lower Openreach line loss of 2% per annum (3% per annum previously),” Credit Suisse said. “Our 2020-22 EBITDA forecasts fall by 0-1% mostly reflecting additional 2020 consumer costs for new initiatives that we expect to boost medium-term profitability.” BT’s move away from sports rights ownership to boost free cash flow BT confirmed that it would bid to retain the Champions League rights for a further three seasons from 2021 when they come up for auction this year but added that the group would take a “very disciplined approach to how we think about sports rights”.
Credit Suisse expects BT’s move away from sports rights ownership to boost free cash flow by up to £200mln by 2023 and would lift its fair value to 330p. “Risks include a deep UK recession and a Department for Digital, Culture, Media and Sport decision regarding a possible ban of Huawei equipment for UK telecom networks,” the bank said. BT’s EE network has dropped Huawei phones from their 5G launch plans amid a US export ban on the Chinese telecoms firm. The UK is still reviewing its 5G telecoms policy and whether to allow Huawei to supply components.
BT, the world’s premier communications company.
Another month, guess what, take a lucky guess, it is the same old story, HM Government, spends more money than it receives via taxes and duties. Another deficit month, thus to bridge the gap, needs to borrow on the bond market. In April 2019 , the HM Government had to borrow money to meet the difference between tax revenues and public sector expenditure. The term for this is The PSNCR: The Public Sector Net Cash Requirement. There were “only” 2 auctions of Gilts (UK Government Bonds) by the UK Debt Management Office to raise cash for HM Treasury:-
23-May-2019 0 1/8% Index-linked Treasury Gilt 2028 3 months £1,437.4960 Million
09-May-2019 1% Treasury Gilt 2024 £3,000.0000 Million
When you add the cash raised:- (£1,437.4960 Million + £3,000.0000 Million) = £4437.496 Million
£4437.496 Million = £4.437496 Billion
On another way of looking at it, is in the 31 days in May, HM Government borrowed:- £143.1450322580645 Million each day for the 31 days. We are fortunate, while the global banking and financial markets still has the confidence in HM Government to buy the Gilts (Lend money to the UK), the budget deficit keeps rising. What is also alarming, is the dates these bond mature 2024 and 2028. All long term borrowings, we are mortgaging our futures, but at least “We Are In It Together….”
Yesterday, Legal & General PLC paid out it’s June 2019 Dividend.
11.82p a share
https://www.londonstockexchange.com/exchange/news/market-news/market-news-detail/LGEN/14096819.html
The total number of voting rights in the Company is 5,960,956,850
Thus:- 5,960,956,850 x £0.1182 = £704,585,099.67
That is £704 Million
https://www.shareshop.hsbc.co.uk/shareshop/security.cgi?csi=10055&action=
6.4% yield
Do not save what is left after spending, but spend what is left after saving.
Warren Buffet
The CQS New City High Yield Fund is a London listed investment trust.
https://ncim.co.uk/cqs-new-city-high-yield-fund-ltd-factsheet-archive/
The objective of the CQS New City High Yield Fund is to To provide investors with a high dividend yield and the potential for capital growth by investing mainly in high yielding fixed interest securities
Top 10 Holdings (%) are:-
Punch Taverns 7.75% 30/12/2025 3.74% of the fund
Perform Group Financing 8.5% 15/11/2020 3.68 % of the fund
CYBG 8% Variable Perpetual 3.38% of the fund
Shawbrook Group 7.875% Variable Perpetual 3.19% of the fund
Galaxy Finco Ltd 7.875% 15/11/2021 2.95% of the fund
Rea Finance 8.75% 31/08/2020 2.63% of the fund
Matalan Finance 9.5% 31/01/2024 2.35% of the fund
Barclays Bank 7% Variable Perpetual 2.34% of the fund
Onesavings Bank Plc 9.125% Variable Perpertual 2.32% of the fund
Wittur Intl 8.5% 15/02/2023 2.29 % of the fund
https://www.shareshop.hsbc.co.uk/shareshop/security.cgi?csi=217829&action=
7.4% yield
On Tue 21st May, Standard Life Aberdeen PLC paid out its May 2019 dividend.
https://www.standardlifeaberdeen.com/
It was 14.3p a share.
The total number of voting rights in the Company as at 29 March 2019 is 2,473,736,726.
https://www.londonstockexchange.com/exchange/news/market-news/market-news-detail/SLA/14023789.html
Thus:- 2,473,736,726 x £0.143 = £353,744,351.818
That is £353m of cash.
https://www.shareshop.hsbc.co.uk/shareshop/security.cgi?csi=186960
8.3% yield.
The Murray International Trust is a London Listed FTSE-250 Investment Trust.
http://www.murray-intl.co.uk/itmurrayinternational/
Its remit is investing predominantly in equities worldwide, managed by Standard Life Aberdeen Twenty largest equity holdings (%)
Taiwan Semiconductor 4.4% of the fund
Grupo Aeroportuario 4.1% of the fund
Taiwan Mobile 3.3% of the fund
Sociedad Quimica Y Minera De Chile 3.1% of the fund
British American TobaccoC 3.1% of the fund
Philip Morris 2.9% of the fund
Unilever Indonesia 2.8% of the fund
Verizon Communications 2.7% of the fund
Daito 2.6% of the fund
Total 2.6% of the fund
Roche 2.5% of the fund
CME 2.3% of the fund
Banco Bradesco 2.3% of the fund
Royal Dutch Shell ‘B’ 2.0% of the fund
SingTel 1.9% of the fund
Public Bank 1.8% of the fund
Intel 1.7% of the fund
TELUS 1.7% of the fund
Vale 1.6% of the fund
Kimberly-Clark de Mexico 1.6% of the fund
Total 51.0% of the fund
Ten largest fixed income holdings (%)
Vale Overseas Limited 6.875% 21/11/36 1.2% of the fund
South Africa (Rep of) 7% 28/02/31 1.1% of the fund
Indonesia (Rep of) 6.125% 15/05/28 0.9% of the fund
Petroleos Mexicanos 6.75% 21/09/47 0.8% of the fund
Indonesia (Rep of) 7% 15/05/22 0.8% of the fund
Mexico (United Mexican States) 5.75% 05/03/26 0.8% of the fund
Uruguay (Rep of) 5.1% 18/06/50 0.8% of the fund
Brazil (Fed Rep of) 10% 01/01/23 0.7% of the fund
Dominican (Rep of) 6.85% 27/01/45 0.7% of the fund
Alfa 6.875% 25/03/44 0.7% of the fund
Total 8.5% of the fund
https://www.shareshop.hsbc.co.uk/shareshop/security.cgi?csi=10252
4.5% yield.
On Tuesday 21st May, Lloyds Banking Group, paid out is May 2019 dividend
2.14p a share
https://www.londonstockexchange.com/exchange/news/market-news/market-news-detail/LLOY/14057769.html
The total number of shares issued by Lloyds Banking Group plc with rights to vote which are exercisable in all circumstances at general meetings is 70,864,314,036 ordinary shares
Thus:- 70,864,314,036 x £0.0214 = £1,516,496,320.3704
That is £1516 Million = £1.516 Billion
https://www.shareshop.hsbc.co.uk/shareshop/security.cgi?csi=10056&action=
5.4% yield