Monthly Archives: January 2017

The Debt of Marks and Spencer

The Debt of Marks and Spencer

Marks and Spencer PLC, the famous UK retailer, has a debt programme to fund its business operations.

http://corporate.marksandspencer.com/investors/debt-investors#edbb67e737a24f9d86ad48628067e7e5

April 2021  Syndicated revolving credit facility  £1.1bn
2017  US$500m  6.250% Semi-annually
2019  £400m  6.125% Annually
2021  £300m  6.125% Annually
2037  US$300m  7.125% Semi-annually
2025 £400m  4.750% Annually

That equates to:-

£1,100m + US$500m + £400m + £300m + US$300m + £400m =

£1100m + £405m + £400m + £300m + £243m + £400m = £2,848m

that is £2.848 Billion

Risk and Reward (Trackers vs Individual Stocks)

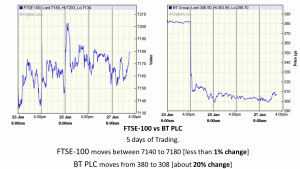
The picture below shows the dangers of a concentration of risk in one asset.

BTandFTSE

In the past days the FTSE has moved little, with highs of over 7,200 to lows of 7135. That is about a movement of 1%

BT plc has traded this week from £3.80 to as low as £2.99. That is price movement of 20%

The benefits of a fund like a FTSE-100 tracker is obvious. Never have all your eggs in one basket.

M&G High Income Investment Trust P.L.C.

The M&G High Income Investment Trust is an London Listed Investment Trust. The Company was incorporated on 23 December 1996 and is a split capital investment trust company with three share classes (Zero Dividend Preference Shares, Income Shares and Capital Shares).

http://www.shareshop.hsbc.co.uk/shareshop/security.cgi?username=&ac=&csi=12782&record_search=1&search_phrase=M&G High Income Investment Trust

http://www.shareshop.hsbc.co.uk/shareshop/security.cgi?username=&ac=&csi=12781&record_search=1&search_phrase=M&G High Income Investment Trust

http://www.shareshop.hsbc.co.uk/shareshop/security.cgi?username=&ac=&csi=12785&record_search=1&search_phrase=M&G High Income Investment Trust

It’s top twenty holdings are:

Treasury 1.00% 2017  8.90% ‘AAA’ credit rated bonds
Treasury 1.25% IL 2017  8.69% ‘AAA’ credit rated bonds
Royal Dutch Shell ‘B’ 4.30% Oil & gas producers
British American Tobacco 4.16% Tobacco
AstraZeneca  3.61% Pharmaceuticals & biotechnology
GlaxoSmithKline 3.45% Pharmaceuticals & biotechnology
HSBC Holdings 3.00% Banks
Vodafone Group 2.70% Mobile telecommunications
BP 2.56% Oil & gas producers
Sage Group 2.19% Software & computer services
Unilever 2.07% Food producers
Imperial Tobacco 2.02% Tobacco
Aviva 1.91% Life insurance
BT Group 1.80% Fixed line telecommunications
RELX 1.79% Media
National Grid 1.62% Gas, water & multi-utilities
United Utilities  1.62% Gas, water & multi-utilities
Legal & General Group 1.57% Life insurance
Essentra 1.49% Support services
Rio Tinto 1.34% Mining

Twenty largest holdings 60.79% = £254million

http://docs.mandg.com/AR/MandG-High-Income-Investment-Trust_Annual-Report-and-Accounts_GB_ENG.pdf

Norges Bank Investment Management: External Fund Managers

One of the largest money managers in the world is Norges Bank. It is the Central Bank of Norway, and manages the profits from its oil industry.

www.nbin.no

Over 7,500 BILLION Krona = £700 Billion = €833 Billion = $869 Billion.

It manages the money with investments in Shares, Fixed Income (bonds) and Real Estate.

It also has manadates with external fund managers:-

External Equity Fund Managers

◾3G Radar
◾A/T Capital Management
◾Abax Investments
◾Ajeej Capital
◾Altus TFI
◾AM Advisors
◾Andino
◾Ashmore Equities Investment Management
◾B & P Asset Management
◾ATR Kim Eng Capital Partners
◾Avaron Asset Management
◾BlackRock
◾BPH TFI
◾Capital International Limited
◾Cephei Capital Management
◾CIM Investment Management
◾Concorde Asset Management
◾DNB Asset Management
◾Dragon Capital Management
◾Duet Mena
◾Eastspring Investments
◾Ecofin
◾Ellerston Capital
◾ENAM Asset Management
◾Fairtree Capital
◾Financiere Arbevel
◾Foord Asset Management
◾FPM Frankfurt Performance Management
◾GCA Investment Management
◾Gondo Visio and Visio Capital Management
◾Greenwoods Asset Management
◾Investec Asset Management
◾Ion Value Management
◾Kairos Partners
◾Karma Capital Advisors
◾Keel Capital
◾Keywise Capital Management
◾Krungsri Asset Management
◾Laurium Capital
◾Lazard Asset Management
◾Levin Capital Strategies
◾Lynear Wealth Management
◾Maybank Asset Management
◾Meritz Asset Management
◾Mirabaud Asset Management
◾Moneda Asset Management
◾Nabo Capital
◾Neuberger Berman Asia
◾Obafrica AM and La Financiere de l’Echiquier
◾Old Mutual Global Investors
◾Operadora GBM
◾Pacific Alternative Asset Management Company
◾Prosperity Capital Management
◾Quantum Advisors Private Limited
◾Rasmala Asset Management
◾Red Gate Asset Management
◾Rheos Capital Works
◾Schroder Investment Management
◾Sparx Asset Management
◾Specialised Research
◾Springs Capital
◾Squadra Investments
◾Steyn Capital Management
◾Templeton Asset Management
◾Temporis Capital
◾Verno Capital
◾Victoire Brasil Investimentos
◾VIP Research & Management
◾Visio Capital Management
◾Water Asset Management
External Fixed-Income Managers

◾Ashmore Equities Investment Management
◾Investec Asset Management
◾Templeton Asset Management

Financial Implications of Brexit: Banking Jobs Leaving the UK

The loss of well paid banking jobs due to Brexit can not be under estimated.

http://www.bbc.co.uk/news/business-38677504

So HSBC and UBS are saying 2,000 investment banking jobs are going to be out transferred of London.
What does this mean financially ?

So lets make some rough calculations:-

HSBC: 1,000 jobs to leave London.
If the average wage of an investment banker at HSBC is £115,000 then the wage bill that leaves London is:
1,000 * £115,000 = £115,000,000 (£115 Million)

UBS:  1,000 jobs to leave London.
If the average wage of an investment banker at UBS is £125,000 then the wage bill that leaves London is:
1,000 * £125,000 = £125,000,000 (£125 Million)

The taxs that will be lost by the UK Goverment:-

HSBC: Wage bill of £115,000,000 and assume 45% goes in total due to income tax and national insurance.
That is £51,750,000 (£51.75 Million)

UBS: Wage bill of £125,000,000 and assume 45% goes in total due to income tax and national insurance.
That is £51,750,000 (£56.250 Million)

A total loss of £108,000,000 (£108m). That is £108m less for HM Government to spend on UK defence, public services like hospitals, schools, universities or police.

Now what else you have to remember, is the salaries after tax, are known as disposable income.

HSBC wage bill of £115 Million, 45% lost in tax (£51.75 Million) leaving £63,250,000) to be spend by employees.
That money is for travel, paying for London Transport, on Oyster or Taxi / Uber. Eating in restaurants, or cinema or buying food at Tesco.
All money that is now lost.

UBS wage bill of £125 Million, 45% lost in tax (£56.250 Million) leaving £68.750) to be spend by employees.
That money is for travel, paying for London Transport, on Oyster or Taxi / Uber. Eating in restaurants, or cinema or buying food at Tesco.
All money that is now lost.

That money supports local jobs, cinema workers, supermarket workers, taxi drivers.

Also those 2,000 people are not paying council tax.

Average Council tax of say £1,100 a year.
2,000 * £1,100 = £2,200,000.00 (£2.2 million) less for councils which means less cash for social care, libraries, refuse/trash collection, street cleaning.

Brexit. Loss of cash for the UK. Serious indeed, and www.asadkarim.co.uk calculations are just on 2,000 jobs.
The Sanditon Investment Trust PLC

The Sanditon Investment Trust plc in a London listed investment company. It invests predominantly in listed equity securities of companies

• which derive a significant proportion of their revenues or profits from; or
• which are predominantly operating in the EU, the EEA or Switzerland.

Top 10 Long Positions:-

Babcock International 6.9%
RELX 5.1%
Melrose Industries 4.3%
Diageo 3.1%
Man Group 2.9%
Laird 2.8%
ITV 2.7%
Sanditon Asset Management 2.6%
BHP Billiton 2.4%
HSBC 2.2%

Total 35.0

http://www.shareshop.hsbc.co.uk/shareshop/security.cgi?username=&ac=&csi=32719505&record_search=1&search_phrase=sit

GlaxoSmithKline January Dividend.

Last week on Thursday 12th Jan, GlaxoSmithKline paid its dividend to its shareholders.

http://www.gsk.com

It was 19p a share.

The total number of voting rights in the Company is 4,910,110,112

http://www.londonstockexchange.com/exchange/news/market-news/market-news-detail/GSK/13083316.html

So the cost of the dividend to GSK was:

4,910,110,112 * £0.19 = £932,920,921.28

That is £932 Million of Cash.

http://www.shareshop.hsbc.co.uk/shareshop/security.cgi?csi=10042

That is a 5% yield.

Aberdeen Frontier Markets Investment Company

The Aberdeen Frontier Markets Investment Company is a £100m investment company, whose objective is to provide shareholders with long term capital growth by investing in the Frontier
Markets of Africa, the Middle East, Eastern Europe, Asia and Latin America.

It’s top ten holdings that make up 65% of the fund are:

Advance Copernico Argentina Fund Argentina 8.6%
East Capital Balkan Fund – C Class Balkans 8.3%
Fondul Proprietatea GDR Romania 8.1%
Tundra Pakistan Fund Pakistan 7.6%
VinaCapital Vietnam Opp. Vietnam 7.0%
PXP Vietnam Emerging Equity Fund Vietnam 6.8%
Sturgeon Central Asia Equities Fund Asia 6.0%
SCM Africa Fund Africa 4.9%
SC Africa Consumer Fund Africa 4.2%
MSCI Pakistan Pakistan 3.9%

Total 65.6%

http://www.shareshop.hsbc.co.uk/shareshop/security.cgi?csi=232655

A yield of 1.5%

Marks and Spencer January 2017 Dividend.

The most famous shop on the UK high street is the highly regarded Marks and Spencer

http://www.marksandspencer.com

Today, Friday 13th Jan 2017 Marks and Spencer pays it dividend.

It is 6.8p a share.

How much will this cost Marks and Spencer PLC today ?

http://otp.investis.com/generic/regulatory-story.aspx?newsid=832422&cid=228

The Company’s capital consists of 1,624,726,830 ordinary shares with voting rights

So 1,624,726,830 x £0.068 = £110,481,424.44

£110m leaves the bank account today.

HM Government December 2016 Borrowings

Another month, guess what, take a lucky guess, it is the same old story, HM Government, spends more money than it receives via taxes and duties. Another deficit month, thus to bridge the gap, needs to borrow on the bond market.

In December 2016, the HM Government had to borrow money to meet the difference between tax revenues and public sector expenditure. The term for this is The PSNCR: The Public Sector Net Cash Requirement.

There were “only” 4 auctions of Gilts (UK Government Bonds) by the UK Debt Management Office (http://www.dmo.gov.uk/) to raise cash for HM Treasury:-

14-Dec-2016 0 1/8% Index-linked Treasury Gilt 2036 £800.0000 Million
07-Dec-2016 1½% Treasury Gilt 2047 £2,250.0000 Million
06-Dec-2016 1½% Treasury Gilt 2026 £2,668.5700 Million
01-Dec-2016 0½% Treasury Gilt 2022 £3,122.8290 Million

[http://www.dmo.gov.uk/reportView.aspx?rptCode=D2.1prof7&rptName=47806644&reportpage=Summary_of_results]

When you add the cash raised:-

∑(£800.0000 Million + £2,250.0000 Million + £2,668.5700 Million + £3,122.8290 Million =  £8,841.399 Million

£8,841.399 Million = £8.841399 Billion

On another way of looking at it, is in the 31 days in December, HM Government borrowed:-

£285million each day for the 31 days.

We are fortunate, while the global banking and financial markets still has the confidence in HM Government to buy the Gilts (Lend money to the UK), the budget deficit keeps rising. What is also alarming, is the dates these bond mature 2022, 2026, 2036 and 2047. All long term borrowings, we are mortgaging our futures, but at least “We are in it together…”


The Debt of Costa Coffee.

The UK High Street is dominated by Costa Coffee on every shopping street.

Costa Coffee is owned by the Whitbread group

https://www.whitbread.co.uk/

To fund operations, apart from the cash generated by the business, Whitbread has a bond issuance programme.

https://www.whitbread.co.uk/investors/key-financial-information/corporate-debt.html

When you add the debt securities issued it comes to £1,706.90 Million.

That is £1.7bn of debt.

Lets keep things in context, its sales are in 15.16 were £2,921.8m.

Rolls Royce PLC: January Dividend.

Yesterday, 6th Jan, Rolls Royce PLC, one of the most highly regarded engineering companies in the world, paid its dividend to its shareholders.

http://www.rollsroyce.com

It was 4.6p per share.

http://www.shareshop.hsbc.co.uk/shareshop/security.cgi?username=&ac=&csi=10072&record_search=1&search_phrase=rr

How cash did the dividend cost Rolls Royce PLC ?

The issued share capital of the Company is comprised off 1,838,787,676 ordinary shares of 20p each with voting rights.

http://otp.investis.com/clients/uk/rolls-royce1/rns/regulatory-story.aspx?cid=171&newsid=822957

Thus

1,838,787,676 x £0.046 = £84,584,233.10

£84m in cash.

Now Blackrock own 5% of Rolls Royce:

http://otp.investis.com/clients/uk/rolls-royce1/rns/regulatory-story.aspx?cid=171&newsid=820016

they have 92,012,850 shares, so they got 92,012,850 * £0.046 = £4,232,591.10 in cash, that is £4.2m

The realities of the Uber economy.

Picture the situation in London. Rent is £1000 a month for a small flat. The tenant is a driver for Uber. Now this person works all day as a self employed driver. They earn about £9 a hour.

One then  has to look at the real picture. So they have to run the car, fuel it, pay for wear and tear on the car, such a tyres.

Then they need to pay themselves a wage. The income is based on picking up passengers. It is not constant.

Wages are low. Tax collected then by the government is low. National Insurance collected by the government is low.

Rent paid by the driver is high, at £1000 a month. The numbers do not work.

Living standards are falling. Taxes collected by government to pay for key public services are falling. People are just making a living.

TR Property Investment Trust

Today, the TR Property Investment Trust, a London listed FTSE-250 Real Estate investment fund paid out a dividend of 4.1p per share.

http://www.trproperty.com/

It invests in Pan European equities and UK direct property on behalf of its shareholders.

It’s top ten indirect holdings are:-

Top Ten Holdings

UNIBAIL-RODAMCO 10.4%
LAND SECURITIES GROUP PLC 7.6%
VONOVIA SE 7.0%
LEG IMMOBILIEN AG 6.2%
KLEPIERRE 5.4%
FONCIERE DES REGIONS 3.1%
BUWOG AG 2.7%
DEUTSCHE WOHNEN AG 2.6%
SEGRO PLC 2.5%
HISPANIA ACTIVOS INMOBILIARIOS SAU 2.5%

It then holds direct properties in its portfolio which accounts for just over 8% of its total holdings:

Strategic allocation (%)

UK Shares 32.3
UK Direct Property 8.8
Continental Shares 71.2
Debt -12.3

TOTAL 100.0 %

http://www.shareshop.hsbc.co.uk/shareshop/security.cgi?username=&ac=&csi=13847&record_search=1&search_phrase=TRY