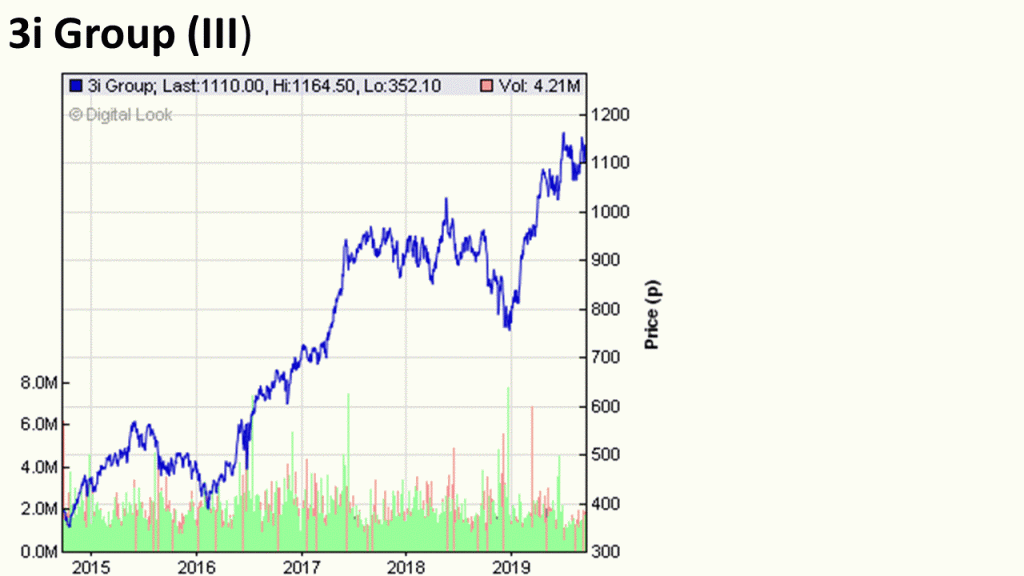
Investment in Iris
Leave a reply
The 500 companies that make up the S&P 500 are:-
Agilent Technologies, Inc. American Airlines Group, Inc. Advance Auto Parts, Inc. Apple, Inc. AbbVie, Inc. AmerisourceBergen Corp. ABIOMED, Inc. Abbott Laboratories Accenture Plc Adobe, Inc. Analog Devices, Inc. Archer-Daniels-Midland Co. Automatic Data Processing, Inc. Alliance Data Systems Corp. Autodesk, Inc. Ameren Corp. American Electric Power Co., Inc. The AES Corp. Aflac, Inc. Allergan Plc American International Group, Inc. Apartment Investment & Management Co. Assurant, Inc. Arthur J. Gallagher & Co. Akamai Technologies, Inc. Albemarle Corp. Align Technology, Inc. Alaska Air Group, Inc. The Allstate Corp. Allegion Plc Alexion Pharmaceuticals, Inc. Applied Materials, Inc. Amcor Plc Advanced Micro Devices, Inc. AMETEK, Inc. Affiliated Managers Group, Inc. Amgen, Inc. Ameriprise Financial, Inc. American Tower Corp. Amazon.com, Inc. Arista Networks, Inc. ANSYS, Inc. Anthem, Inc. Aon Plc A. O. Smith Corp. Apache Corp. Air Products & Chemicals, Inc. Amphenol Corp. Aptiv Plc Alexandria Real Estate Equities, Inc. Arconic, Inc. Atmos Energy Corp. Activision Blizzard, Inc. AvalonBay Communities, Inc. Broadcom, Inc. Avery Dennison Corp. American Water Works Co., Inc. American Express Co. AutoZone, Inc. The Boeing Co. Bank of America Corp. Baxter International, Inc. BB&T Corp. Best Buy Co., Inc. Becton, Dickinson & Co. Franklin Resources, Inc. Brown-Forman Corp. Baker Hughes, a GE Co. Biogen, Inc. The Bank of New York Mellon Corp. Booking Holdings, Inc. BlackRock, Inc. Ball Corp. Bristol-Myers Squibb Co. Broadridge Financial Solutions, Inc. Berkshire Hathaway, Inc. Boston Scientific Corp. BorgWarner, Inc. Boston Properties, Inc. Citigroup, Inc. Conagra Brands, Inc. Cardinal Health, Inc. Caterpillar, Inc. Chubb Ltd. Cboe Global Markets, Inc. CBRE Group, Inc. CBS Corp. Crown Castle International Corp. Carnival Corp. Cadence Design Systems, Inc. Celanese Corp. Celgene Corp. Cerner Corp. CF Industries Holdings, Inc. Citizens Financial Group, Inc. (Rhode Island) Church & Dwight Co., Inc. C.H. Robinson Worldwide, Inc. Charter Communications, Inc. Cigna Corp. Cincinnati Financial Corp. Colgate-Palmolive Co. The Clorox Co. Comerica, Inc. Comcast Corp. CME Group, Inc. Chipotle Mexican Grill, Inc. Cummins, Inc. CMS Energy Corp. Centene Corp. CenterPoint Energy, Inc. Capital One Financial Corp. Cabot Oil & Gas Corp. The Cooper Cos., Inc. ConocoPhillips Costco Wholesale Corp. Coty, Inc. Campbell Soup Co. Capri Holdings Ltd. Copart, Inc. salesforce.com, inc. Cisco Systems, Inc. CSX Corp. Cintas Corp. CenturyLink, Inc. Cognizant Technology Solutions Corp. Corteva, Inc. Citrix Systems, Inc. CVS Health Corp. Chevron Corp. Concho Resources, Inc. Dominion Energy, Inc. Delta Air Lines, Inc. DuPont de Nemours, Inc. Deere & Co. Discover Financial Services Dollar General Corp. Quest Diagnostics, Inc. D.R. Horton, Inc. Danaher Corp. The Walt Disney Co. Discovery, Inc. Discovery, Inc. DISH Network Corp. Digital Realty Trust, Inc. Dollar Tree, Inc. Dover Corp. Dow, Inc. Duke Realty Corp. Darden Restaurants, Inc. DTE Energy Co. Duke Energy Corp. DaVita, Inc. Devon Energy Corp. DXC Technology Co. Electronic Arts, Inc. eBay, Inc. Ecolab, Inc. Consolidated Edison, Inc. Equifax, Inc. Edison International The Estée Lauder Companies, Inc. Eastman Chemical Co. Emerson Electric Co. EOG Resources, Inc. Equinix, Inc. Equity Residential Eversource Energy Essex Property Trust, Inc. E*TRADE Financial Corp. Eaton Corp. Plc Entergy Corp. Evergy, Inc. Edwards Lifesciences Corp. Exelon Corp. Expeditors International of Washington, Inc. Expedia Group, Inc. Extra Space Storage, Inc. Ford Motor Co. Diamondback Energy, Inc. Fastenal Co. Facebook, Inc. Fortune Brands Home & Security, Inc. Freeport-McMoRan, Inc. FedEx Corp. FirstEnergy Corp. F5 Networks, Inc. Fidelity National Information Services, Inc. Fiserv, Inc. Fifth Third Bancorp FLIR Systems, Inc. Flowserve Corp. FleetCor Technologies, Inc. FMC Corp. Fox Corp. Fox Corp. First Republic Bank (San Francisco, California) Federal Realty Investment Trust TechnipFMC Plc Fortinet, Inc. Fortive Corp. General Dynamics Corp. General Electric Co. Gilead Sciences, Inc. General Mills, Inc. Globe Life, Inc. Corning, Inc. General Motors Co. Alphabet, Inc. Alphabet, Inc. Genuine Parts Co. Global Payments, Inc. Gap, Inc. Garmin Ltd. The Goldman Sachs Group, Inc. W.W. Grainger, Inc. Halliburton Co. Hasbro, Inc. Huntington Bancshares, Inc. Hanesbrands, Inc. HCA Healthcare, Inc. HCP, Inc. The Home Depot, Inc. Hess Corp. HollyFrontier Corp. The Hartford Financial Services Group, Inc. Huntington Ingalls Industries, Inc. Hilton Worldwide Holdings, Inc. Harley-Davidson, Inc. Hologic, Inc. Honeywell International, Inc. Helmerich & Payne, Inc. Hewlett-Packard Enterprise Co. HP, Inc. H&R Block, Inc. Hormel Foods Corp. Henry Schein, Inc. Host Hotels & Resorts, Inc. The Hershey Co. Humana, Inc. International Business Machines Corp. Intercontinental Exchange, Inc. IDEXX Laboratories, Inc. IDEX Corp. International Flavors & Fragrances, Inc. Illumina, Inc. Incyte Corp. IHS Markit Ltd. Intel Corp. Intuit, Inc. International Paper Co. Interpublic Group of Cos., Inc. IPG Photonics Corp. IQVIA Holdings, Inc. Ingersoll-Rand Plc Iron Mountain, Inc. Intuitive Surgical, Inc. Gartner, Inc. Illinois Tool Works, Inc. Invesco Ltd. J.B. Hunt Transport Services, Inc. Johnson Controls International Plc Jacobs Engineering Group, Inc. Jefferies Financial Group, Inc. Jack Henry & Associates, Inc. Johnson & Johnson Juniper Networks, Inc. JPMorgan Chase & Co. Nordstrom, Inc. Kellogg Co. KeyCorp Keysight Technologies, Inc. The Kraft Heinz Co. Kimco Realty Corp. KLA Corp. Kimberly-Clark Corp. Kinder Morgan, Inc. CarMax, Inc. The Coca-Cola Co. The Kroger Co. Kohl’s Corp. Kansas City Southern Loews Corp. L Brands, Inc. Leidos Holdings, Inc. Leggett & Platt, Inc. Lennar Corp. Laboratory Corp. of America Holdings L3Harris Technologies, Inc. Linde Plc LKQ Corp. Eli Lilly & Co. Lockheed Martin Corp. Lincoln National Corp. Alliant Energy Corp. Lowe’s Cos., Inc. Lam Research Corp. Southwest Airlines Co. Lamb Weston Holdings, Inc. LyondellBasell Industries NV Macy’s, Inc. Mastercard, Inc. Mid-America Apartment Communities, Inc. Macerich Co. Marriott International, Inc. Masco Corp. McDonald’s Corp. Microchip Technology, Inc. McKesson Corp. Moody’s Corp. Mondelez International, Inc. Medtronic Plc MetLife, Inc. MGM Resorts International Mohawk Industries, Inc. McCormick & Co., Inc. MarketAxess Holdings, Inc. Martin Marietta Materials, Inc. Marsh & McLennan Cos., Inc. 3M Co. Monster Beverage Corp. Altria Group, Inc. The Mosaic Co. Marathon Petroleum Corp. Merck & Co., Inc. Marathon Oil Corp. Morgan Stanley MSCI, Inc. Microsoft Corp. Motorola Solutions, Inc. M&T Bank Corp. Mettler-Toledo International, Inc. Micron Technology, Inc. Maxim Integrated Products, Inc. Mylan NV Noble Energy, Inc. Norwegian Cruise Line Holdings Ltd. Nasdaq, Inc. NextEra Energy, Inc. Newmont Goldcorp Corp. Netflix, Inc. NiSource, Inc. NIKE, Inc. Nektar Therapeutics Nielsen Holdings Plc Northrop Grumman Corp. National Oilwell Varco, Inc. NRG Energy, Inc. Norfolk Southern Corp. NetApp, Inc. Northern Trust Corp. Nucor Corp. NVIDIA Corp. Newell Brands, Inc. News Corp. News Corp. Realty Income Corp. ONEOK, Inc. Omnicom Group, Inc. Oracle Corp. O’Reilly Automotive, Inc. Occidental Petroleum Corp. Paychex, Inc. People’s United Financial, Inc. PACCAR, Inc. Public Service Enterprise Group, Inc. PepsiCo, Inc. Pfizer Inc. Principal Financial Group, Inc. Procter & Gamble Co. Progressive Corp. Parker-Hannifin Corp. PulteGroup, Inc. Packaging Corporation of America PerkinElmer, Inc. (United States) Prologis, Inc. Philip Morris International, Inc. The PNC Financial Services Group, Inc. Pentair Plc Pinnacle West Capital Corp. PPG Industries, Inc. PPL Corp. Perrigo Co. Plc Prudential Financial, Inc. Public Storage Phillips 66 PVH Corp. Quanta Services, Inc. Pioneer Natural Resources Co. PayPal Holdings, Inc. QUALCOMM, Inc. Qorvo, Inc. Royal Caribbean Cruises Ltd. Everest Re Group Ltd. Regency Centers Corp. Regeneron Pharmaceuticals, Inc. Regions Financial Corp. Robert Half International, Inc. Raymond James Financial, Inc. Ralph Lauren Corp. ResMed, Inc. Rockwell Automation, Inc. Rollins, Inc. Roper Technologies, Inc. Ross Stores, Inc. Republic Services, Inc. Raytheon Co. SBA Communications Corp. Starbucks Corp. The Charles Schwab Corp. Sealed Air Corp. The Sherwin-Williams Co. SVB Financial Group The J. M. Smucker Co. Schlumberger NV SL Green Realty Corp. Snap-On, Inc. Synopsys, Inc. The Southern Co. Simon Property Group, Inc. S&P Global, Inc. Sempra Energy SunTrust Banks, Inc. State Street Corp. Seagate Technology Plc Constellation Brands, Inc. Stanley Black & Decker, Inc. Skyworks Solutions, Inc. Synchrony Financial Stryker Corp. Symantec Corp. Sysco Corp. AT&T, Inc. Molson Coors Brewing Co. TransDigm Group, Inc. TE Connectivity Ltd. Teleflex, Inc. Target Corp. Tiffany & Co. The TJX Cos., Inc. Thermo Fisher Scientific, Inc. T-Mobile US, Inc. Tapestry, Inc. TripAdvisor, Inc. T. Rowe Price Group, Inc. The Travelers Cos., Inc. Tractor Supply Co. Tyson Foods, Inc. Total System Services, Inc. Take-Two Interactive Software, Inc. Twitter, Inc. Texas Instruments Incorporated Textron, Inc. Under Armour, Inc. Under Armour, Inc. United Airlines Holdings, Inc. UDR, Inc. Universal Health Services, Inc. Ulta Beauty, Inc. UnitedHealth Group, Inc. Unum Group Union Pacific Corp. United Parcel Service, Inc. United Rentals, Inc. U.S. Bancorp United Technologies Corp. Visa, Inc. Varian Medical Systems, Inc. VF Corp. Viacom, Inc. Valero Energy Corp. Vulcan Materials Co. Vornado Realty Trust Verisk Analytics, Inc. VeriSign, Inc. Vertex Pharmaceuticals, Inc. Ventas, Inc. Verizon Communications, Inc. Westinghouse Air Brake Technologies Corp. Waters Corp. Walgreens Boots Alliance, Inc. WellCare Health Plans, Inc. Western Digital Corp. WEC Energy Group, Inc. Welltower, Inc. Wells Fargo & Co. Whirlpool Corp. Willis Towers Watson Plc Waste Management, Inc. The Williams Cos., Inc. Walmart, Inc. WestRock Co. The Western Union Co. Weyerhaeuser Co. Wynn Resorts Ltd. Cimarex Energy Co. Xcel Energy, Inc. Xilinx, Inc. Exxon Mobil Corp. Dentsply Sirona, Inc. Xerox Holdings Corp. Xylem, Inc. Yum! Brands, Inc. Zimmer Biomet Holdings, Inc. Zions Bancorporation NA Zoetis, Inc.
AT&T. American Telegraph and Telephone.
It is being crushed under a mountain of debt. The current debt outstanding is in total:-
$ 170,561,666,814
That is $170bn. It’s long term position is $ 157,789,862,515
That is $157.79bn.
Entity (Original Issuer) Amount Outstanding at Maturity Coupon Maturity Date Current Portion Long-term Portion Total Various $2,248,411,294 (c) various various $92,884,734 $2,155,526,560 $2,248,411,294 BellSouth Corporation $1,000,000,000 4.266% 26/04/2021 (a) $1,000,000,000 $0 $1,000,000,000 AT&T Inc. $592,000,000 Zero 27/11/2022 (b) $502,230,845 $0 $502,230,845 AT&T Inc. CHF 450,000,000 0.500% 04/12/2019 $460,923,896 $0 $460,923,896 AT&T Inc. $2,850,000,000 (d) Floating 31/12/2019 $2,850,000,000 $0 $2,850,000,000 AT&T Inc. $800,000,000 Floating 15/01/2020 $800,000,000 $0 $800,000,000 AT&T Inc. $2,750,441,000 2.450% 30/06/2020 $2,750,441,000 $0 $2,750,441,000 AT&T Inc. $686,719,000 Floating 30/06/2020 $686,719,000 $0 $686,719,000 AT&T Inc. € 2,250,000,000 Floating 03/08/2020 $0 $2,558,925,000 $2,558,925,000 AT&T Inc. CAD 1,000,000,000 3.825% 25/11/2020 $0 $763,650,248 $763,650,248 AT&T Inc. € 1,000,000,000 1.875% 04/12/2020 $0 $1,137,300,000 $1,137,300,000 AT&T Inc. $750,000,000 (d) Floating 26/01/2021 $0 $750,000,000 $750,000,000 AT&T Inc. $682,696,000 4.600% 15/02/2021 $0 $682,696,000 $682,696,000 AT&T Inc. $1,694,999,000 2.800% 17/02/2021 $0 $1,694,999,000 $1,694,999,000 AT&T Inc. $853,159,000 4.450% 15/05/2021 $0 $853,159,000 $853,159,000 AT&T Inc. $1,500,000,000 Floating 01/06/2021 $0 $1,500,000,000 $1,500,000,000 AT&T Inc. $1,500,000,000 Floating 15/07/2021 $0 $1,500,000,000 $1,500,000,000 AT&T Inc. $1,171,605,000 3.875% 15/08/2021 $0 $1,171,605,000 $1,171,605,000 AT&T Inc. € 1,000,000,000 2.650% 17/12/2021 $0 $1,137,300,000 $1,137,300,000 Michigan Bell Telephone Company $102,800,000 7.850% 15/01/2022 $0 $102,800,000 $102,800,000 Time Warner Inc. $77,900,000 4.000% 15/01/2022 $0 $77,900,000 $77,900,000 AT&T Inc. $83,184,000 7.850% 15/01/2022 $0 $83,184,000 $83,184,000 AT&T Inc. $422,057,000 4.000% 15/01/2022 $0 $422,057,000 $422,057,000 AT&T Inc. $1,456,834,000 3.000% 15/02/2022 $0 $1,456,834,000 $1,456,834,000 AT&T Inc. $1,250,000,000 3.200% 01/03/2022 $0 $1,250,000,000 $1,250,000,000 AT&T Inc. $1,012,016,000 3.800% 15/03/2022 $0 $1,012,016,000 $1,012,016,000 DIRECTV Holdings LLC / DIRECTV Financing Co., Inc. $65,028,000 3.800% 15/03/2022 $0 $65,028,000 $65,028,000 AT&T Inc. € 1,500,000,000 1.450% 01/06/2022 $0 $1,705,950,000 $1,705,950,000 Time Warner Inc. $97,308,000 3.400% 15/06/2022 $0 $97,308,000 $97,308,000 AT&T Inc. $402,679,000 3.400% 15/06/2022 $0 $402,679,000 $402,679,000 AT&T Inc. $1,961,516,000 3.000% 30/06/2022 $0 $1,961,516,000 $1,961,516,000 AT&T Inc. $1,118,743,000 2.625% 01/12/2022 $0 $1,118,743,000 $1,118,743,000 Historic TW Inc. $115,871,000 9.150% 01/02/2023 $0 $115,871,000 $115,871,000 AT&T Inc. $125,918,000 9.150% 01/02/2023 $0 $125,918,000 $125,918,000 AT&T Inc. $250,418,000 Floating 15/02/2023 $0 $250,418,000 $250,418,000 AT&T Inc. $1,890,061,000 3.600% 17/02/2023 $0 $1,890,061,000 $1,890,061,000 AT&T Inc. € 1,250,000,000 2.500% 15/03/2023 $0 $1,421,625,000 $1,421,625,000 AT&T Inc. $500,000,000 (d) Floating 28/04/2023 $0 $500,000,000 $500,000,000 AT&T Inc. € 426,473,000 2.750% 19/05/2023 $0 $485,027,743 $485,027,743 DIRECTV Holdings LLC / DIRECTV Financing Co., Inc. € 73,461,000 2.750% 19/05/2023 $0 $83,547,195 $83,547,195 AT&T Inc. $3,050,000,000 (d) Floating 20/05/2023 $0 $3,050,000,000 $3,050,000,000 AT&T Inc. € 1,250,000,000 1.300% 05/09/2023 $0 $1,421,625,000 $1,421,625,000 AT&T Inc. € 878,507,000 Floating 05/09/2023 $0 $999,126,011 $999,126,011 AT&T Inc. € 450,273,000 1.050% 05/09/2023 $0 $512,095,483 $512,095,483 Time Warner Inc. € 164,028,000 1.950% 15/09/2023 $0 $186,549,044 $186,549,044 AT&T Inc. € 535,591,000 1.950% 15/09/2023 $0 $609,127,644 $609,127,644 AT&T Inc. AUD 475,000,000 3.450% 19/09/2023 $0 $333,450,000 $333,450,000 AT&T Inc. AUD 150,000,000 Floating 19/09/2023 $0 $105,300,000 $105,300,000 Time Warner Inc. $88,713,000 4.050% 15/12/2023 $0 $88,713,000 $88,713,000 AT&T Inc. $411,202,000 4.050% 15/12/2023 $0 $411,202,000 $411,202,000 Historic TW Inc. $49,643,000 7.570% 01/02/2024 $0 $49,643,000 $49,643,000 AT&T Inc. $54,176,000 7.570% 01/02/2024 $0 $54,176,000 $54,176,000 AT&T Inc. $750,000,000 (d) Floating 29/02/2024 $0 $750,000,000 $750,000,000 AT&T Inc. $750,000,000 3.800% 01/03/2024 $0 $750,000,000 $750,000,000 AT&T Inc. $1,000,000,000 3.900% 11/03/2024 $0 $1,000,000,000 $1,000,000,000 AT&T Inc. € 1,600,000,000 2.400% 15/03/2024 $0 $1,819,680,000 $1,819,680,000 AT&T Inc. $1,207,937,000 4.450% 01/04/2024 $0 $1,207,937,000 $1,207,937,000 DIRECTV Holdings LLC / DIRECTV Financing Co., Inc. $42,036,000 4.450% 01/04/2024 $0 $42,036,000 $42,036,000 AT&T Inc. CAD 600,000,000 2.850% 25/05/2024 $0 $458,190,149 $458,190,149 Time Warner Inc. $160,452,000 3.550% 01/06/2024 $0 $160,452,000 $160,452,000 AT&T Inc. $589,458,000 3.550% 01/06/2024 $0 $589,458,000 $589,458,000 AT&T Inc. $3,750,000,000 Floating 12/06/2024 $0 $3,750,000,000 $3,750,000,000 AT&T Inc. $300,000,000 (d) Floating 23/06/2024 $0 $300,000,000 $300,000,000 AT&T Inc. CHF 450,000,000 1.375% 04/12/2024 $0 $460,923,896 $460,923,896 AT&T Inc. $1,161,110,000 3.950% 15/01/2025 $0 $1,161,110,000 $1,161,110,000 DIRECTV Holdings LLC / DIRECTV Financing Co., Inc. $38,659,000 3.950% 15/01/2025 $0 $38,659,000 $38,659,000 AT&T Inc. $5,000,000,000 3.400% 15/05/2025 $0 $5,000,000,000 $5,000,000,000 Time Warner Inc. $170,004,000 3.600% 15/07/2025 $0 $170,004,000 $170,004,000 AT&T Inc. $1,329,934,000 3.600% 15/07/2025 $0 $1,329,934,000 $1,329,934,000 BellSouth Telecommunications, Inc. $105,567,000 7.000% 01/10/2025 $0 $105,567,000 $105,567,000 AT&T Inc. $55,006,000 7.000% 01/10/2025 $0 $55,006,000 $55,006,000 AT&T Inc. CAD 1,250,000,000 4.000% 25/11/2025 $0 $954,562,810 $954,562,810 AT&T Inc. € 1,000,000,000 3.500% 17/12/2025 $0 $1,137,300,000 $1,137,300,000 Historic TW Inc. $16,568,000 6.850% 15/01/2026 $0 $16,568,000 $16,568,000 Time Warner Inc. $58,841,000 3.875% 15/01/2026 $0 $58,841,000 $58,841,000 AT&T Inc. $541,141,000 3.875% 15/01/2026 $0 $541,141,000 $541,141,000 AT&T Inc. AUD 300,000,000 4.100% 19/01/2026 $0 $210,600,000 $210,600,000 AT&T Inc. $2,650,000,000 4.125% 17/02/2026 $0 $2,650,000,000 $2,650,000,000 Pacific Bell $279,817,000 7.125% 15/03/2026 $0 $279,817,000 $279,817,000 AT&T Inc. $257,200,000 7.125% 15/03/2026 $0 $257,200,000 $257,200,000 Time Warner Inc. $92,725,000 2.950% 15/07/2026 $0 $92,725,000 $92,725,000 AT&T Inc. $707,258,000 2.950% 15/07/2026 $0 $707,258,000 $707,258,000 AT&T Inc. $1,323,529,412 (d) 2.270% 10/08/2026 $176,470,588 $1,147,058,824 $1,323,529,412 Indiana Bell Telephone Company, Incorporated $28,063,000 7.300% 15/08/2026 $0 $28,063,000 $28,063,000 AT&T Inc. $21,270,000 7.300% 15/08/2026 $0 $21,270,000 $21,270,000 AT&T Inc. € 1,489,219,000 1.800% 05/09/2026 $0 $1,693,688,769 $1,693,688,769 BellSouth Capital Funding Corporation $4,295,000 6.040% 15/11/2026 $0 $4,295,000 $4,295,000 Wisconsin Bell, Inc. $60,000 6.350% 01/12/2026 $0 $60,000 $60,000 AT&T Inc. £ 750,000,000 2.900% 04/12/2026 $0 $952,200,000 $952,200,000 Time Warner Inc. $170,784,000 3.800% 15/02/2027 $0 $170,784,000 $170,784,000 AT&T Inc. $1,329,194,000 3.800% 15/02/2027 $0 $1,329,194,000 $1,329,194,000 AT&T Inc. $2,000,000,000 4.250% 01/03/2027 $0 $2,000,000,000 $2,000,000,000 AT&T Inc. £ 600,000,000 5.500% 15/03/2027 $0 $761,760,000 $761,760,000 AT&T Inc. $1,250,000,000 (d) 3.380% 31/08/2027 $147,058,824 $1,102,941,176 $1,250,000,000 Ameritech Capital Funding Corporation $43,380,000 6.875% 15/10/2027 $0 $43,380,000 $43,380,000 AT&T Inc. $11,000,000 6.875% 15/10/2027 $0 $11,000,000 $11,000,000 Ameritech Capital Funding Corporation $104,205,000 6.550% 15/01/2028 $0 $104,205,000 $104,205,000 Historic TW Inc. $82,846,000 6.950% 15/01/2028 $0 $82,846,000 $82,846,000 AT&T Inc. $114,586,000 6.550% 15/01/2028 $0 $114,586,000 $114,586,000 AT&T Inc. $43,801,000 6.950% 15/01/2028 $0 $43,801,000 $43,801,000 AT&T Inc. $2,449,011,000 4.100% 15/02/2028 $0 $2,449,011,000 $2,449,011,000 BellSouth Telecommunications, Inc. $215,798,000 6.375% 01/06/2028 $0 $215,798,000 $215,798,000 AT&T Inc. $95,418,000 6.375% 01/06/2028 $0 $95,418,000 $95,418,000 AT&T Inc. AUD 400,000,000 4.600% 19/09/2028 $0 $280,800,000 $280,800,000 AT&T Inc. $3,000,000,000 4.350% 01/03/2029 $0 $3,000,000,000 $3,000,000,000 AT&T Corp. $120,939,000 6.500% 15/03/2029 $0 $120,939,000 $120,939,000 AT&T Inc. $6,820,000 6.500% 15/03/2029 $0 $6,820,000 $6,820,000 Historic TW Inc. $96,296,000 6.625% 15/05/2029 $0 $96,296,000 $96,296,000 AT&T Inc. $190,040,000 6.625% 15/05/2029 $0 $190,040,000 $190,040,000 AT&T Inc. € 1,260,469,000 2.350% 05/09/2029 $0 $1,433,531,394 $1,433,531,394 AT&T Inc. £ 745,000,000 4.375% 14/09/2029 $0 $945,852,000 $945,852,000 DIRECTV Holdings LLC / DIRECTV Financing Co., Inc. £ 4,940,000 4.375% 14/09/2029 $0 $6,271,824 $6,271,824 AT&T Inc. € 800,000,000 2.600% 17/12/2029 $0 $909,840,000 $909,840,000 BellSouth Capital Funding Corporation $121,479,000 7.875% 15/02/2030 $0 $121,479,000 $121,479,000 AT&T Inc. $3,156,272,000 4.300% 15/02/2030 $0 $3,156,272,000 $3,156,272,000 AT&T Inc. $201,852,000 7.875% 15/02/2030 $0 $201,852,000 $201,852,000 AT&T Inc. CHF 150,000,000 1.875% 04/12/2030 $0 $153,641,299 $153,641,299 AT&T Wireless Services, Inc. $348,622,000 8.750% 01/03/2031 $0 $348,622,000 $348,622,000 AT&T Inc. $216,393,000 8.750% 01/03/2031 $0 $216,393,000 $216,393,000 Time Warner Inc. $194,243,000 7.625% 15/04/2031 $0 $194,243,000 $194,243,000 AT&T Inc. $187,707,000 7.625% 15/04/2031 $0 $187,707,000 $187,707,000 BellSouth Corporation $125,832,000 6.875% 15/10/2031 $0 $125,832,000 $125,832,000 AT&T Inc. $169,287,000 6.875% 15/10/2031 $0 $169,287,000 $169,287,000 AT&T Corp. $168,465,000 8.750% 15/11/2031 $0 $168,465,000 $168,465,000 AT&T Inc. $217,786,000 8.250% 15/11/2031 $0 $217,786,000 $217,786,000 Cingular Wireless LLC $195,000,000 7.125% 15/12/2031 $0 $195,000,000 $195,000,000 AT&T Inc. $148,730,000 7.125% 15/12/2031 $0 $148,730,000 $148,730,000 Time Warner Inc. $153,445,000 7.700% 01/05/2032 $0 $153,445,000 $153,445,000 AT&T Inc. $156,925,000 7.700% 01/05/2032 $0 $156,925,000 $156,925,000 AT&T Inc. € 1,400,000,000 3.550% 17/12/2032 $0 $1,592,220,000 $1,592,220,000 AT&T Inc. £ 342,361,000 5.200% 18/11/2033 $0 $434,661,526 $434,661,526 DIRECTV Holdings LLC / DIRECTV Financing Co., Inc. £ 7,599,000 5.200% 18/11/2033 $0 $9,647,690 $9,647,690 AT&T Inc. € 500,000,000 3.375% 15/03/2034 $0 $568,650,000 $568,650,000 BellSouth Corporation $157,011,000 6.550% 15/06/2034 $0 $157,011,000 $157,011,000 AT&T Inc. $252,536,000 6.450% 15/06/2034 $0 $252,536,000 $252,536,000 AT&T Inc. $143,801,000 6.550% 15/06/2034 $0 $143,801,000 $143,801,000 AT&T Inc. $356,075,000 6.150% 15/09/2034 $0 $356,075,000 $356,075,000 BellSouth Corporation $227,344,000 6.000% 15/11/2034 $0 $227,344,000 $227,344,000 AT&T Inc. $71,388,000 6.000% 15/11/2034 $0 $71,388,000 $71,388,000 AT&T Inc. € 1,250,000,000 2.450% 15/03/2035 $0 $1,421,625,000 $1,421,625,000 AT&T Inc. $2,500,000,000 4.500% 15/05/2035 $0 $2,500,000,000 $2,500,000,000 Historic TW Inc. $157,766,000 8.300% 15/01/2036 $0 $157,766,000 $157,766,000 AT&T Inc. $128,330,000 6.800% 15/05/2036 $0 $128,330,000 $128,330,000 AT&T Inc. € 1,750,000,000 3.150% 04/09/2036 $0 $1,990,275,000 $1,990,275,000 Time Warner Inc. $90,652,000 6.500% 15/11/2036 $0 $90,652,000 $90,652,000 AT&T Inc. $160,252,000 6.500% 15/11/2036 $0 $160,252,000 $160,252,000 AT&T Inc. $3,000,000,000 5.250% 01/03/2037 $0 $3,000,000,000 $3,000,000,000 AT&T Inc. $1,278,679,000 4.900% 15/08/2037 $0 $1,278,679,000 $1,278,679,000 AT&T Inc. $412,098,000 6.500% 01/09/2037 $0 $412,098,000 $412,098,000 Ameritech Capital Funding Corporation $3,549,000 5.950% 15/01/2038 $0 $3,549,000 $3,549,000 AT&T Inc. $849,360,000 6.300% 15/01/2038 $0 $849,360,000 $849,360,000 AT&T Inc. $8,040,000 5.950% 15/01/2038 $0 $8,040,000 $8,040,000 AT&T Inc. $229,036,000 6.400% 15/05/2038 $0 $229,036,000 $229,036,000 AT&T Inc. $510,063,000 6.550% 15/02/2039 $0 $510,063,000 $510,063,000 AT&T Inc. $2,000,000,000 4.850% 01/03/2039 $0 $2,000,000,000 $2,000,000,000 AT&T Inc. $490,483,000 6.350% 15/03/2040 $0 $490,483,000 $490,483,000 Time Warner Inc. $27,389,000 6.200% 15/03/2040 $0 $27,389,000 $27,389,000 DIRECTV Holdings LLC / DIRECTV Financing Co., Inc. $9,517,000 6.350% 15/03/2040 $0 $9,517,000 $9,517,000 AT&T Inc. $329,267,000 6.200% 15/03/2040 $0 $329,267,000 $329,267,000 AT&T Inc. £ 1,100,000,000 7.000% 30/04/2040 $0 $1,396,560,000 $1,396,560,000 Time Warner Inc. $66,554,000 6.100% 15/07/2040 $0 $66,554,000 $66,554,000 AT&T Inc. $392,704,000 6.100% 15/07/2040 $0 $392,704,000 $392,704,000 AT&T Inc. $1,234,030,000 6.000% 15/08/2040 $0 $1,234,030,000 $1,234,030,000 DIRECTV Holdings LLC / DIRECTV Financing Co., Inc. $15,947,000 6.000% 15/08/2040 $0 $15,947,000 $15,947,000 AT&T Inc. $1,789,560,000 5.350% 01/09/2040 $0 $1,789,560,000 $1,789,560,000 AT&T Inc. $984,108,000 6.375% 01/03/2041 $0 $984,108,000 $984,108,000 DIRECTV Holdings LLC / DIRECTV Financing Co., Inc. $15,874,000 6.375% 01/03/2041 $0 $15,874,000 $15,874,000 Time Warner Inc. $73,554,000 6.250% 29/03/2041 $0 $73,554,000 $73,554,000 AT&T Inc. $521,724,000 6.250% 29/03/2041 $0 $521,724,000 $521,724,000 AT&T Inc. $1,009,543,000 5.550% 15/08/2041 $0 $1,009,543,000 $1,009,543,000 Time Warner Inc. $52,683,000 5.375% 15/10/2041 $0 $52,683,000 $52,683,000 AT&T Inc. $447,305,000 5.375% 15/10/2041 $0 $447,305,000 $447,305,000 AT&T Inc. $1,208,505,000 5.150% 15/03/2042 $0 $1,208,505,000 $1,208,505,000 DIRECTV Holdings LLC / DIRECTV Financing Co., Inc. $41,433,000 5.150% 15/03/2042 $0 $41,433,000 $41,433,000 Time Warner Inc. $105,500,000 4.900% 15/06/2042 $0 $105,500,000 $105,500,000 AT&T Inc. $394,320,000 4.900% 15/06/2042 $0 $394,320,000 $394,320,000 AT&T Inc. $1,956,149,000 4.300% 15/12/2042 $0 $1,956,149,000 $1,956,149,000 AT&T Inc. £ 1,000,000,000 4.250% 01/06/2043 $0 $1,269,600,000 $1,269,600,000 Time Warner Inc. $63,661,000 5.350% 15/12/2043 $0 $63,661,000 $63,661,000 AT&T Inc. $436,339,000 5.350% 15/12/2043 $0 $436,339,000 $436,339,000 AT&T Inc. £ 1,250,000,000 4.875% 01/06/2044 $0 $1,587,000,000 $1,587,000,000 Time Warner Inc. $129,343,000 4.650% 01/06/2044 $0 $129,343,000 $129,343,000 AT&T Inc. $470,656,000 4.650% 01/06/2044 $0 $470,656,000 $470,656,000 AT&T Inc. $2,500,000,000 4.800% 15/06/2044 $0 $2,500,000,000 $2,500,000,000 AT&T Inc. $1,295,000,000 4.700% 10/11/2044 $0 $1,295,000,000 $1,295,000,000 AT&T Inc. $2,619,000,000 4.600% 12/02/2045 $0 $2,619,000,000 $2,619,000,000 AT&T Inc. $3,043,850,000 4.350% 15/06/2045 $0 $3,043,850,000 $3,043,850,000 Time Warner Inc. $104,314,000 4.850% 15/07/2045 $0 $104,314,000 $104,314,000 AT&T Inc. $795,686,000 4.850% 15/07/2045 $0 $795,686,000 $795,686,000 BellSouth Telecommunications, Inc. $52,482,000 5.850% 15/11/2045 $0 $52,482,000 $52,482,000 AT&T Inc. $379,000 5.850% 15/11/2045 $0 $379,000 $379,000 AT&T Inc. $3,500,000,000 4.750% 15/05/2046 $0 $3,500,000,000 $3,500,000,000 AT&T Inc. $1,750,725,000 5.150% 15/11/2046 $0 $1,750,725,000 $1,750,725,000 AT&T Inc. $1,500,000,000 5.650% 15/02/2047 $0 $1,500,000,000 $1,500,000,000 AT&T Inc. $2,000,000,000 5.450% 01/03/2047 $0 $2,000,000,000 $2,000,000,000 AT&T Inc. CAD 750,000,000 4.850% 25/05/2047 $0 $572,737,686 $572,737,686 AT&T Inc. $1,430,000,000 5.500% 15/06/2047 $0 $1,430,000,000 $1,430,000,000 AT&T Inc. $4,499,999,000 4.500% 09/03/2048 $0 $4,499,999,000 $4,499,999,000 AT&T Inc. CAD 750,000,000 5.100% 25/11/2048 $0 $572,737,686 $572,737,686 AT&T Inc. $2,500,000,000 4.550% 09/03/2049 $0 $2,500,000,000 $2,500,000,000 AT&T Inc. $1,694,666,000 5.150% 15/02/2050 $0 $1,694,666,000 $1,694,666,000 AT&T Inc. $1,000,000,000 5.700% 01/03/2057 $0 $1,000,000,000 $1,000,000,000 AT&T Inc. $643,744,000 5.300% 15/08/2058 $0 $643,744,000 $643,744,000 AT&T Inc. $1,322,500,000 5.350% 01/11/2066 $0 $1,322,500,000 $1,322,500,000 AT&T Inc. $825,000,000 5.625% 01/08/2067 $0 $825,000,000 $825,000,000 BellSouth Telecommunications, Inc. $77,270,000 7.000% 01/12/2095 $0 $77,270,000 $77,270,000 AT&T Inc. $45,534,000 7.000% 01/12/2095 $0 $45,534,000 $45,534,000 BellSouth Telecommunications, Inc. $41,584,000 6.650% 15/12/2095 $0 $41,584,000 $41,584,000 AT&T Inc. $32,050,000 6.650% 15/12/2095 $0 $32,050,000 $32,050,000 BellSouth Capital Funding Corporation $89,932,000 7.120% 15/07/2097 $0 $89,932,000 $89,932,000 AT&T Inc. $85,856,000 7.120% 15/07/2097 $0 $85,856,000 $85,856,000 $9,466,728,887 $159,354,463,658 $168,821,192,545 $3,163,873,226 – $3,163,873,226 $3,992,932 – $3,992,932 $137,209,253 $1,808,744,696 $1,945,953,949 – $26,725,736 $26,725,736 ($465,509,331) ($465,509,331) – ($2,939,413,217) ($2,939,413,217) – $4,850,973 $4,850,973 $12,771,804,299 (e) $157,789,862,515 (f) $170,561,666,814 Putable annually in April. Putable annually in May. Includes credit agreements at Mexico and DTV Latin America subsidiaries Credit agreement / Term loan facility; Maturity date represents final maturity Amount shown as debt maturing within one year on AT&T’s consolidated balance sheet. Amount shown as long-term debt on AT&T’s consolidated balance sheet.
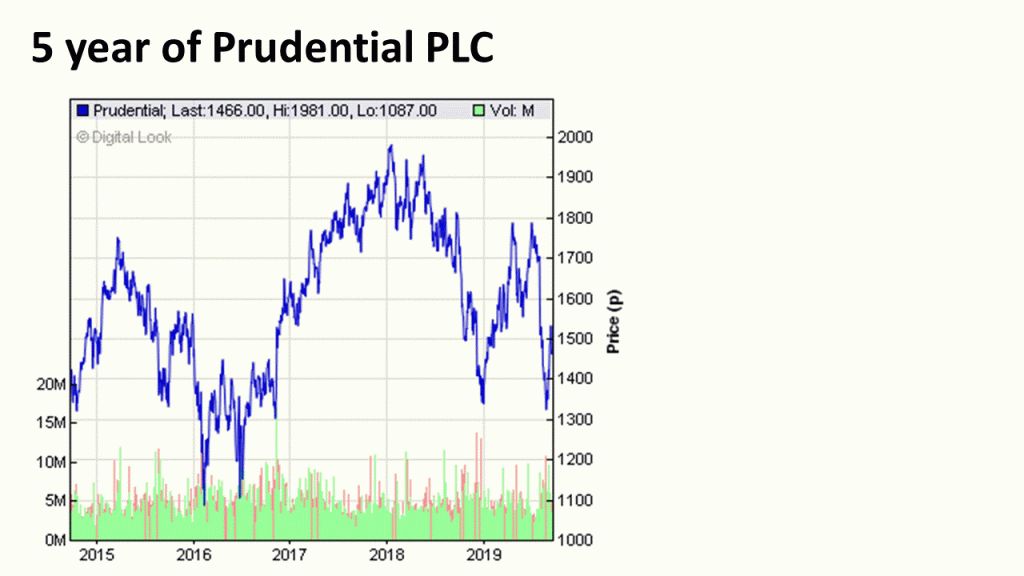
Prudential is one of the UK’s premier life insurance companies, and investment management firms.
www.prudential.co.uk
And back in the spring of 1720, Sir Isaac Newton owned shares in the South Sea Company, the hottest stock in England. Sensing that the market was getting out of hand, the great physicist muttered that he “could calculate the motions of the heavenly bodies, but not the madness of the people.” Newton dumped his South Sea shares, pocketing a 100% profit totaling £7,000. But just months later, swept up in the wild enthusiasm of the market, Newton jumped back in at a much higher price—and lost £20,000 (or more than $3 million in today’s money). For the rest of his life, he forbade anyone to speak the words “South Sea” in his presence
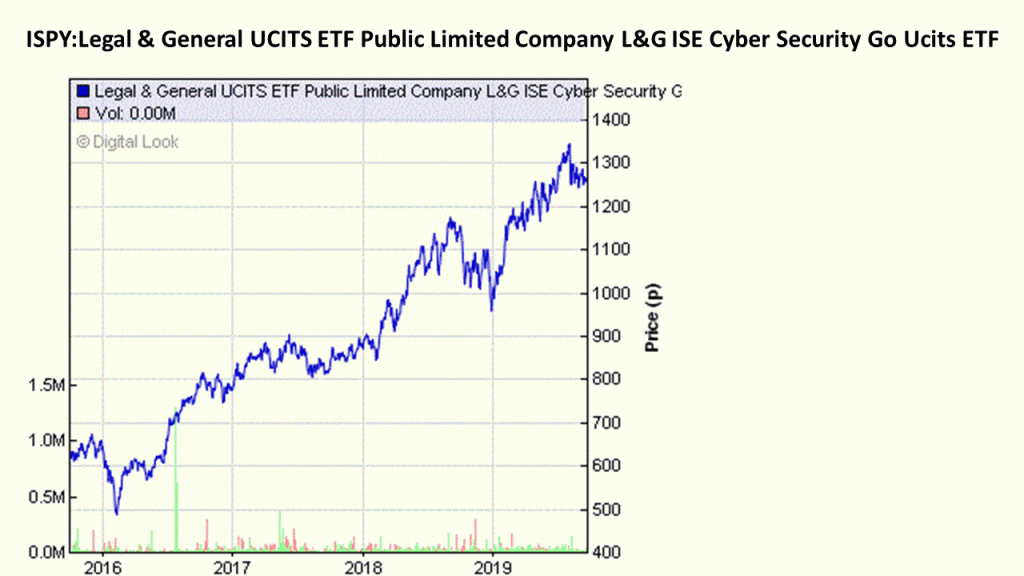
Legal & General UCITS ETF Public Limited Company L&G ISE Cyber Security Go Ucits ETF
Look a the performance:-
Yesterday, HICL the London listed infrastructure company paid it’s quarterly dividend.
2.06p a share.
The total issued share capital with voting rights is 1,791,142,767
https://www.londonstockexchange.com/exchange/news/market-news/market-news-detail/HICL/14013053.html
Thus:- 1,791,142,767 x £0.0206 = £36,897,541.0002
That is £36m.