The four most dangerous words in investing are: this time it’s different.
Wise Words
Leave a reply
The four most dangerous words in investing are: this time it’s different.
Another month, guess what, take a lucky guess, it is the same old story, HM Government, spends more money than it receives via taxes and duties. Another deficit month, thus to bridge the gap, needs to borrow on the bond market.
In June 2018 , the HM Government had to borrow money to meet the difference between tax revenues and public sector expenditure. The term for this is The PSNCR: The Public Sector Net Cash Requirement.
There were “only” 3 auctions of Gilts (UK Government Bonds) by the UK Debt Management Office (http://www.dmo.gov.uk/) to raise cash for HM Treasury:-
26-Jun-2018 1¾% Treasury Gilt 2037 £2,587.4950 Million
20-Jun-2018 0 1/8% Index-linked Treasury Gilt 2028 3 months £1,381.4000 Million
06-Jun-2018 0¾% Treasury Gilt 2023 £2,750.0000 Million
When you add the cash raised:-
(2,587.4950 Million + £1,381.4000 Million + £2,750.0000 Million) = £6718.895 Million
£6718.895 Million = £6.718895 Billion
On another way of looking at it, is in the 30 days in June, HM Government borrowed:-
£223 million each day for the 30 days.
We are fortunate, while the global banking and financial markets still has the confidence in HM Government to buy the Gilts (Lend money to the UK), the budget deficit keeps rising. What is also alarming, is the dates these bond mature 2023, 2028 and 2037. All long term borrowings, we are mortgaging our futures, but at least “We Are In It Together….”
The Weiss Korea Opportunity Fund
The Weiss Korea Opportunity Fund is an investment company, that is geographically focused on investing in South Korean companies.
http://www.weisskoreaopportunityfund.com/
Top 10 Holdings
Samsung Electronics Co. 23% of the fund
LG Electronics Inc. 8% of the fund
Samsung Electro-Mechanics Co. 6% of the fund
Samsung SDI Co., Ltd. 5% of the fund
CJ CheilJedang Corp. 5% of the fund
Hyundai Motor Company. 5% of the fund
Korea Investment Holdings Co. 4% of the fund
CJ Corporation. 3% of the fund
Hyundai Motor Company. 3% of the fund
LG Household & Health Care Ltd. 3% of the fund
Top 10 Holdings 66% of the fund
http://www.shareshop.hsbc.co.uk/shareshop/security.cgi?csi=8703386&action=
The UK’s National Grid is the power transmission company of the United Kingdom.
It carries a lot of debt to fund its operations.
The current outstanding debt is £23.0 billion (2017: £19.3 billion).
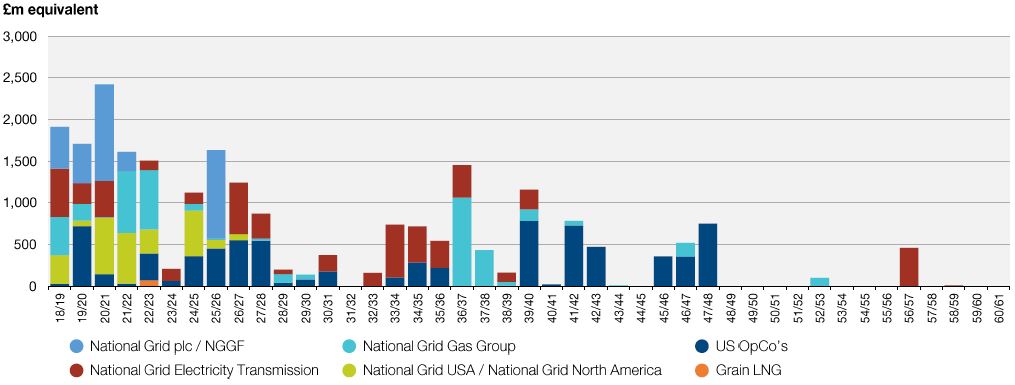
The interest payments on the debt (statutory net finance costs) were £745 million.
The effective interest rate on Treasury managed debt for the year was 4.6%
However, one has to note, that cash generated from continuing operations was £4,702 million, (£4.7 Billion)
http://www.shareshop.hsbc.co.uk/shareshop/security.cgi?csi=51261
A yield of 5%
Thames Water is the London water Utility.
www.thameswater.co.uk
It is owned by a group of investors:-
“Ontario Municipal Employees Retirement System (“OMERS”), one of Canada’s largest pension plans, and Wren House, the global direct infrastructure investment arm of the Kuwait Investment Authority, acquired the 26.3% managed stake from Macquire an Australian bank. OMERS has since agreed to increase its investment by a further 5.530%. When our recent sales complete towards the end of 2017, Thames Water will be jointly owned by 14 institutional investors – made up mostly of pension funds and sovereign wealth funds. The three largest
investors will represent pension funds – one based in Canada and two in the UK. All of our investors take a long-term view of the company’s infrastructure, its customers and the natural environment”
It carries debt to fund its business:-
a total of debt of £10,749.4 Million. That is £10.749 Billion
| Book Value Bonds including accretion Class A | 7,101.5 |
| Book Value Bonds including accretion Class B | 850.0 |
| Total Book Value Bonds including accretion | 7,951.5 |
| Class A USPP Notes | 479.1 |
| Class B USPP Notes | 119.8 |
| Class A RPI linked loans including accretion of £134.4m | 1,264.4 |
| Accretion on Index-linked Swaps | 223.3 |
| Class A Floating Rate Loans | 492.0 |
| Class A Cross-currency swaps | (78.9) |
| Class B Cross-currency swaps | (23.2) |
| Class B Loans | 179.0 |
| Less TWUL Cash Investments | (57.5) |
| TWUL Net Debt as per Compliance Certificate | 10,549.5 |
| Fees and Discounts | (75.2) |
| Intercompany Loans* | 300.0 |
| Derivative financial liabilities | (208.4) |
| Interest payable on amounts owed to group undertakings | 179.2 |
| Interest payable on secured bank loans | 4.3 |
| TWUL Net Debt as per accounts at 31 March 2017 | 10,749.4 |
| Issuer | Currency | Face Value
(currency m) |
Coupon % | Maturity Date | Class | Description | Face Value and accretion at 31 Mar 17 (£m) | |
| TWUCF | GBP | 550.0 | 5.375% | 21/07/2017* | B | Fixed Rate Bond | 550.0 | |
| TWUF | GBP | 200.0 | 5.050% | 30/06/2020 | A | Fixed Rate Bond | 200.0 | |
| TWUF | GBP | 225.0 | 6.590% | 20/04/2021 | A | Fixed Rate Bond | 225.0 | |
| TWUF | GBP | 175.0 | 3.375% | 21/07/2021 | A | RPI Linked Bond | 264.3 | |
| TWUCF | EUR | 113.0 | 2.300% | 18/07/2022 | A | CPI Linked Bond | 100.6 | |
| TWUCF | GBP | 300.0 | 5.750% | 13/09/2030 | B | Fixed Rate Bond | 300.0 | |
| TWUCF | GBP | 500.0 | 4.000% | 19/06/2025 | A | Fixed Rate Bond | 500.0 | |
| TWUCF | GBP | 45.0 | 0.721% | 21/12/2027 | A | RPI Linked Bond | 46.0 | |
| TWUCF | GBP | 300.0 | 3.5% | 25/02/2028 | A | Fixed Rate Bond | 300.0 | |
| TWUF | GBP | 330.0 | 6.750% | 16/11/2028 | A | Fixed Rate Bond | 330.0 | |
| TWUF | GBP | 200.0 | 6.500% | 09/02/2032 | A | Fixed Rate Bond | 200.0 | |
| TWUCF | GBP | 300.0 | 4.375% | 03/07/2034 | A | Fixed Rate Bond | 300.0 | |
| TWUCF | GBP | 40.0 | 0.75% | 18/12/2034 | A | RPI Linked Bond | 40.9 | |
| TWUF | GBP | 600.0 | 5.125% | 28/09/2037 | A | Fixed Rate Bond | 600.0 | |
| TWUCF | JPY | 20,000.0 | 3.280% | 20/08/2038 | A | Fixed Rate Bond | 143.3 | |
| TWUCF | GBP | 50.0 | 3.853% | 15/12/2040 | A | LPI Linked Bond | 60.9 | |
| TWUCF | GBP | 500.0 | 5.500% | 11/02/2041 | A | Fixed Rate Bond | 500.0 | |
| TWUCF | GBP | 50.0 | 1.980% | 28/08/2042 | A | RPI Linked Bond | 64.4 | |
| TWUCF | GBP | 55.0 | 2.091% | 06/10/2042 | A | RPI Linked Bond | 68.4 | |
| TWUCF | GBP | 40.0 | 1.974% | 12/10/2045 | A | RPI Linked Bond | 45.7 | |
| TWUCF | GBP | 300.0 | 4.625% | 04/06/2046 | A | Fixed Rate Bond | 300.0 | |
| TWUCF | GBP | 100.0 | 1.846% | 28/08/2047 | A | RPI Linked Bond | 128.9 | |
| TWUCF | GBP | 200.0 | 1.819% | 28/08/2049 | A | RPI Linked Bond | 257.8 | |
| TWUF | GBP | 300.0 | 1.680% | 11/07/2053 | A | RPI Linked Bond | 408.2 | |
| TWUF | GBP | 300.0 | 1.681% | 11/07/2055 | A | RPI Linked Bond | 408.2 | |
| TWUCF | GBP | 200.0 | 1.771% | 28/08/2057 | A | RPI Linked Bond | 257.8 | |
| TWUCF | GBP | 400.0 | 7.738% | 09/04/2058 | A | Fixed Rate Bond | 400.0 | |
| TWUCF | GBP | 350.0 | 1.760% | 28/08/2062 | A | RPI Linked Bond | 451.1 | |
| TWUCF | GBP | 250.0 | 1.875% | 24/01/2024 | A | Fixed Rate Bond | 250.0 | |
| TWUCF | GBP | 250.0 | 2.625% | 24/01/2032 | A | Fixed Rate Bond | 250.0 | |
| Total | 7,951.5
|
|||||||
Today the FTSE-100, the UK Flagship Index of the UK’s largest 100 companies is worth a lot of money.
£2,129,423.22 Million to be precise.
That is £2.129 TRILLION. That figure is larger than UK GDP.
101 companies because of the dual listing for Royal Dutch Shell, which trades as Royal Dutch Shell “A” and Royal Dutch Shell “B”
| Position | Symbol | Company | Market Capitalisation £m |
| 1 | HSBA | HSBC Holdings | £142,052.77 |
| 2 | RDSA | Royal Dutch Shell A | £120,008.21 |
| 3 | BP. | BP | £115,576.52 |
| 4 | RDSB | Royal Dutch Shell B | £100,716.11 |
| 5 | BATS | British American Tobacco | £87,849.26 |
| 6 | GSK | GlaxoSmithKline | £75,870.76 |
| 7 | DGE | Diageo | £66,984.00 |
| 8 | AZN | AstraZeneca | £66,536.99 |
| 9 | RIO | Rio Tinto | £55,246.45 |
| 10 | GLEN | Glencore | £52,217.56 |
| 11 | ULVR | Unilever | £50,680.14 |
| 12 | VOD | Vodafone | £49,036.85 |
| 13 | LLOY | Lloyds Banking Group | £45,474.30 |
| 14 | PRU | Prudential | £44,955.83 |
| 15 | RB. | Reckitt Benckiser Group | £44,052.37 |
| 16 | SHP | Shire | £38,982.71 |
| 17 | BLT | BHP Billiton | £36,030.68 |
| 18 | BARC | Barclays | £32,335.08 |
| 19 | RBS | Royal Bank of Scotland Group | £30,801.96 |
| 20 | NG. | National Grid | £28,141.47 |
| 21 | IMB | Imperial Brands | £26,914.46 |
| 22 | CPG | Compass Group | £25,631.83 |
| 23 | TSCO | Tesco | £25,261.01 |
| 24 | SKY | Sky | £25,123.44 |
| 25 | AAL | Anglo American | £23,808.03 |
| 26 | STAN | Standard Chartered | £23,141.48 |
| 27 | CRH | CRH | £22,394.66 |
| 28 | ABF | Associated British Foods | £21,676.04 |
| 29 | BT.A | BT Group | £21,609.90 |
| 30 | BA. | BAE Systems | £20,652.56 |
| 31 | AV. | Aviva | £20,351.60 |
| 32 | RR. | Rolls-Royce Holdings | £18,475.16 |
| 33 | EXPN | Experian | £17,198.38 |
| 34 | REL | RELX | £16,988.15 |
| 35 | LGEN | Legal & General Group | £15,850.56 |
| 36 | LSE | London Stock Exchange Group | £15,558.49 |
| 37 | WPP | WPP | £15,052.46 |
| 38 | FERG | Ferguson | £14,255.63 |
| 39 | SSE | SSE | £13,755.76 |
| 40 | IAG | International Consolidated Airlines | £13,490.74 |
| 41 | SN. | Smith & Nephew | £12,225.21 |
| 42 | RRS | Randgold Resources | £11,425.01 |
| 43 | AHT | Ashtead Group | £11,115.20 |
| 44 | INF | Informa | £10,450.37 |
| 45 | MRO | Melrose Industries | £10,179.66 |
| 46 | TUI | TUI AG | £9,765.31 |
| 47 | ANTO | Antofagasta | £9,759.98 |
| 48 | SLA | Standard Life Aberdeen | £9,704.01 |
| 49 | HL. | Hargreaves Lansdown | £9,351.19 |
| 50 | CCH | Coca Cola HBC AG | £9,317.48 |
| 51 | ITRK | Intertek Group | £9,225.23 |
| 52 | BRBY | Burberry Group | £9,028.27 |
| 53 | IHG | InterContinental Hotels Group | £8,999.62 |
| 54 | CCL | Carnival | £8,933.55 |
| 55 | CNA | Centrica | £8,894.88 |
| 56 | III | 3i Group | £8,762.00 |
| 57 | SDR | Schroders | £8,541.95 |
| 58 | NXT | Next | £8,507.67 |
| 59 | FRES | Fresnillo | £8,426.38 |
| 60 | PSN | Persimmon | £7,885.55 |
| 61 | BNZL | Bunzl | £7,716.97 |
| 62 | SMT | Scottish Mortgage Investment Trust | £7,547.63 |
| 63 | MNDI | Mondi | £7,532.11 |
| 64 | NMC | NMC Health | £7,458.11 |
| 65 | EVR | Evraz | £7,338.00 |
| 66 | SKG | Smurfit Kappa Group | £7,272.91 |
| 67 | WTB | Whitbread | £7,268.77 |
| 68 | OCDO | Ocado Group | £7,166.75 |
| 69 | RSA | RSA Insurance Group | £7,137.38 |
| 70 | LAND | Land Securities Group | £7,095.03 |
| 71 | SBRY | Sainsbury (J) | £7,065.51 |
| 72 | ITV | ITV | £7,004.21 |
| 73 | JMAT | Johnson Matthey | £7,003.97 |
| 74 | PPB | Paddy Power Betfair | £6,953.87 |
| 75 | PSON | Pearson | £6,908.93 |
| 76 | SGE | Sage Group | £6,811.02 |
| 77 | SGRO | Segro | £6,771.34 |
| 78 | SMIN | Smiths Group | £6,720.00 |
| 79 | EZJ | Easyjet | £6,645.29 |
| 80 | BLND | British Land | £6,602.15 |
| 81 | RTO | Rentokil Initial | £6,466.41 |
| 82 | KGF | Kingfisher | £6,340.13 |
| 83 | CRDA | Croda International | £6,321.50 |
| 84 | DCC | DCC | £6,158.74 |
| 85 | GVC | GVC Holdings | £6,074.96 |
| 86 | STJ | St. James’s Place | £6,073.72 |
| 87 | MRW | Morrison (Wm) Supermarkets | £5,936.99 |
| 88 | TW. | Taylor Wimpey | £5,861.90 |
| 89 | MCRO | Micro Focus International | £5,774.67 |
| 90 | SMDS | Smith (DS) | £5,600.61 |
| 91 | ADM | Admiral Group | £5,488.66 |
| 92 | JE. | Just Eat | £5,302.28 |
| 93 | BDEV | Barratt Developments | £5,218.67 |
| 94 | UU. | United Utilities Group | £5,204.17 |
| 95 | HLMA | Halma | £5,201.09 |
| 96 | BKG | Berkeley Group Holdings | £5,077.83 |
| 97 | RMG | Royal Mail | £5,054.00 |
| 98 | RMV | Rightmove | £4,810.83 |
| 99 | MKS | Marks & Spencer Group | £4,794.72 |
| 100 | DLG | Direct Line Insurance Group | £4,714.88 |
| 101 | SVT | Severn Trent | £4,687.63 |
| £2,129,423.22 |
The Legal & General Global Infrastructure Index Fund targets companies that own, operate, manage or maintain essential infrastructure across a range of sectors, including utilities, industrials, and oil and gas.
a £250m fund
http://www.lgim.com/files/_document-library/adviser/global-infrastructure-index-fund-profile.pdf
Top 10 Holdings %
Union Pacific Corp 5.95% of the fund
Nextera Energy Inc 4.30% of the fund
American Tower Corp 3.45% of the fund
Canadian National Railway 3.09% of the fund
Duke Energy Corp 3.06% of the fund
Enbridge 2.92% of the fund
CSX Corp 2.67% of the fund
Southern Co 2.50% of the fund
Crown Castle Intl Corp 2.48% of the fund
Dominion Energy 2.43% of the fund
Total 32.85% of the fund are the top 10 holdings.
Public sector net debt, excluding public sector banks, is £1,781.4bn that is equivalent to 85% of GDP.
Or with 60m people in the UK, that is about £30,000 per person in the UK.

https://www.youtube.com/watch?v=tqTOZLd3Cjw
The JPMorgan Global Growth & Income plc is a London listed investment trust.
The objective of the fund is to deliver total returns and outperform the MSCI All Country World Index over the long-term by investing in companies based around the world. The Company makes quarterly dividends.
10 Largest Holdings are:
Alphabet 4.4% of the fund
Microsoft Technology 2.8% of the fund
United Health Group 2.8% of the fund
Prudential 2.0% of the fund
Pioneer Natural Resources 1.9% of the fund
Union Pacific 1.7% of the fund
Visa 1.6% of the fund
Standard Chartered 1.6% of the fund
Citigroup 1.6% of the fund
O Reilly Auto Parts 1.5% of the fund
2% yield.
Warren Buffet quote:-
“Cash combined with courage in a time of crisis is priceless.”

Vodafone.
Carries a lot of debt.
http://www.vodafone.com/content/index/investors/debt_investors.html#
Reading the annual report you see it has revenues of £41,649.80 Million = £41.6Bn.
The level of debt is very interesting:-
The Debt of Vodafone 2017:- €m €m €m
Short-Term Long-Term Total
Bank loans: 867 2,741 3,608
Bonds: 660 19,345 20,005
Other liabilities: 4,632 305 4,937
Bonds in designated hedge relationships 2,244 12,132 14,37
Total: 12,051 34,523 46,574
That is €m 46,574 = £40,725.5 = £40.725 Bn