Leading central banks now own more than £18 trillion in government bonds and other assets, an increase of more than 50% on pre-pandemic levels. This is an eye-watering expansion from the financial crash more than a decade ago. Since the start of the pandemic, the US Federal Reserve’s (the Fed) balance sheet has more than doubled to $8tn (£5.9tn). The European Central bank has total assets worth more than €8tn (£6.8tn), the Bank of Japan has about 722tn yen (£4.8tn), while the UK has doubled its QE programme to £895bn.
Despite the flood of cheap money, more than a decade of meagre growth has followed the 2008 crisis, as Quantative Easing only succeeded in pumping up asset prices – benefiting owners of shares and property most. However, the post-2008 recovery was sapped by governments launching damaging austerity policies, while central bankers argue Quantative Easing helped avoid worse job losses.
Another month, guess what, take a lucky guess, it is the same old story, HM Government, spends more money than it receives via taxes and duties. Now we are in a Covid 19 world. UK’s HM Government needs to fund many new demands. [www.dmo.gov.uk]
Another deficit month, thus to bridge the gap, needs to borrow on the bond market In July 2021, the HM Government had to borrow money to meet the difference between tax revenues and public sector expenditure. The term for this is The PSNCR: The Public Sector Net Cash Requirement. There were “only” 6 auctions of Gilts (UK Government Bonds) by the UK Debt Management Office to raise cash for HM Treasury:-
27-Jul-2021 0 3/8% Treasury Gilt 2026 3,000.0000 Million 20-Jul-2021 1 5/8% Treasury Gilt 2071 1,562.5000 Million 07-Jul-2021 0 1/8% Index-linked Treasury Gilt 2051 3 months 701.0500 Million 06-Jul-2021 0¼% Treasury Gilt 2031 3,437.4990 Million 06-Jul-2021 0½% Treasury Gilt 2061 1,866.2500 Million 01-Jul-2021 0¼% Treasury Gilt 2025 4,232.4970 Million Thus:-
£3,000.0000 Million + £1,562.5000 Million + £701.0500 Million + £3,437.4990 Million + £1,866.2500 Million + £4,232.4970 Million = £14,799.796 Million
£14,799.796 Million = £14.799796 Billion
On another way of looking at it, is in the 31 days in July 2021, HM Government borrowed:- £477.41277419354838709677419354839 Million each day for the 31 days.
We are fortunate, while the global banking and financial markets still has the confidence in HM Government to buy the Gilts (Lend money to the UK), the budget deficit keeps rising. What is also alarming, is the dates these bond mature from 2025 through to 2071. All long term borrowings, we are mortgaging our futures, but at least “We Are In It Together….”
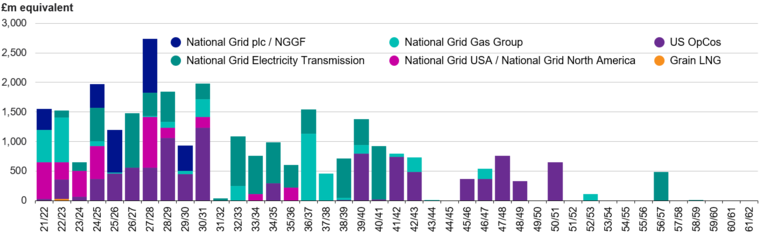
National Grid is one of the world’s largest publicly listed utilities focused on transmission and distribution of electricity and gas in the United Kingdom and the United States. It plays a vital role in connecting millions of people to the energy they use safely, reliably and efficiently.
It finances its operations from trading and debt. It currently has Net debt of £28.6bn as of March 31st 2021. It has to pay back this debt from now to the end of 2057.
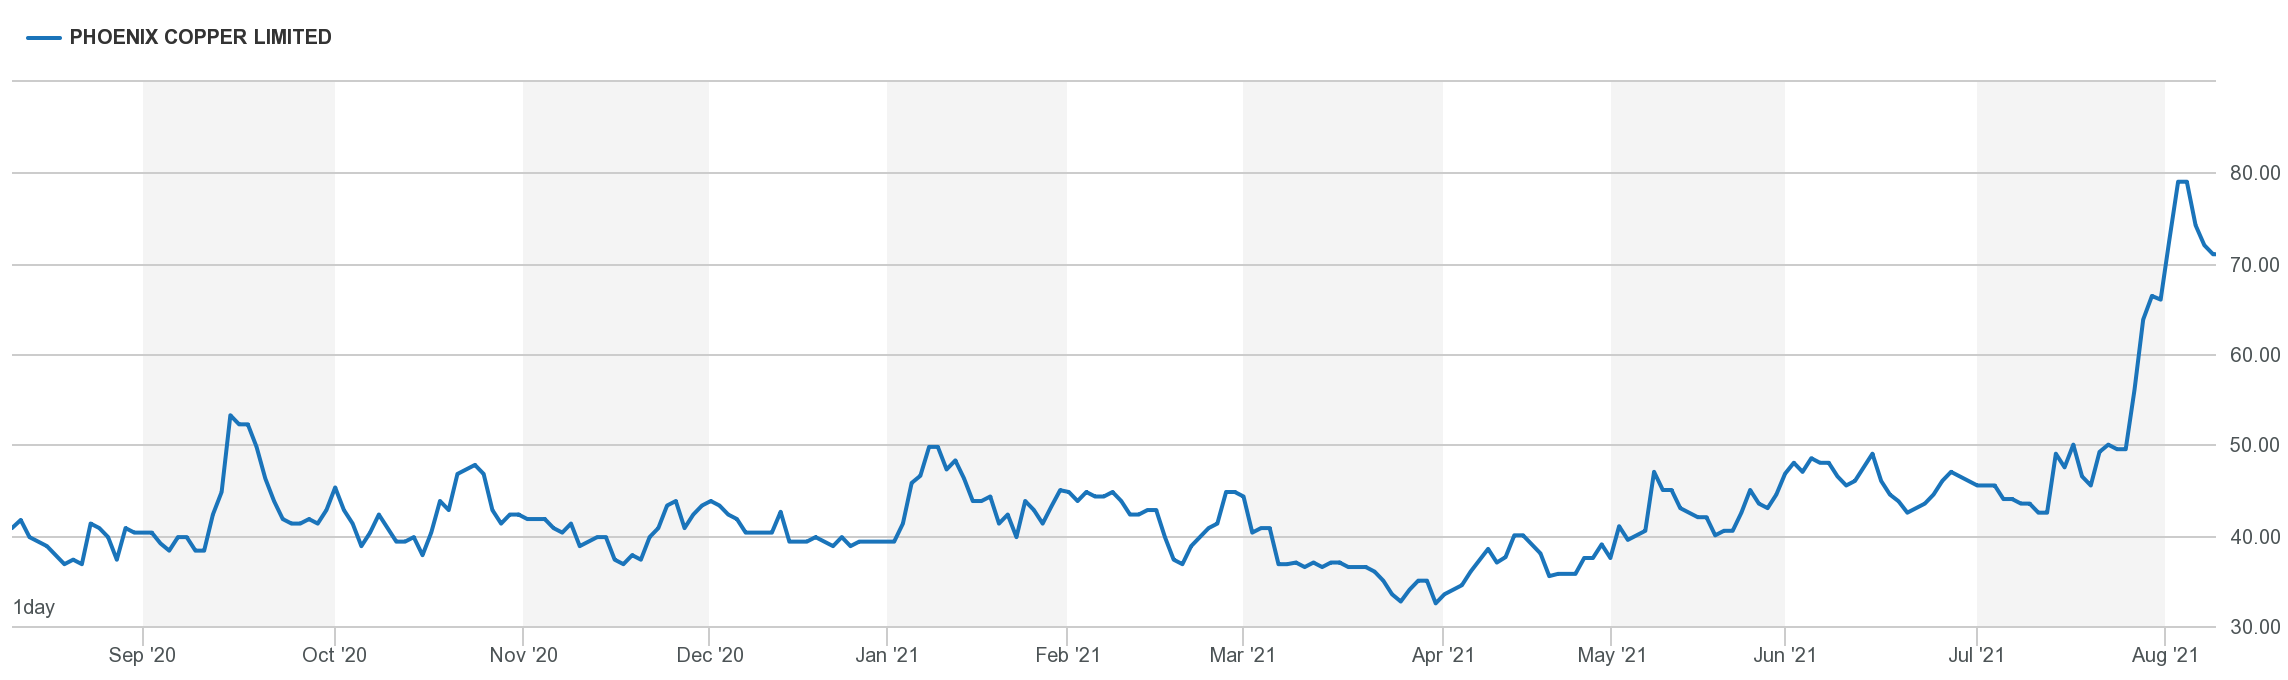
worldwide shortage of semiconductors has sharply curtailed production so far this year.
in addition, The US Fed are continuing to increase their holdings of Treasury securities by at least $80 billion per month and of agency MBS by at least $40 billion per month
The UK Debt Management Office, that issues Gilts (UK Government Bonds) to help finance the HM Government’s spending commitments, has a website that is full of data.
UK wealth gap widens in pandemic as richest get £50,000 windfall Resolution Foundation finds rising house and asset prices have ‘turbo-charged’ gap between richest and poorest
Britain’s wealth gap has ballooned during the pandemic with the richest 10% gaining £50,000 on average, dwarfing increases for the poorest third of the population, according to a thinktank report.
The Resolution Foundation said wealth had increased during lockdown as a result of a lack of spending opportunities and rising house prices, but the benefits had been skewed to the richest by a ratio of more than 500 to 1.
Jack Leslie, a senior economist at the thinktank, said it was rare for wealth to increase during a recession but the impact of events during 2020 and 2021 had been to “turbo-charge” the gap between rich and poor.
The Resolution Foundation – which focuses on improving living standards for those on low and middle incomes – said the findings of the report should cause the government to rethink its decision to scrap the £20 a week increase to universal credit in September.
The report, produced in partnership with the Standard Life Foundation, found that the average household had enjoyed a windfall of £7,800 per adult during the crisis – the first time wealth has increased during a recession since the mid-1940s
“The Covid-19 crisis has seen a highly unusual combination of a sharp reduction in economic activity, and a sharp increase in household wealth. Many families have been forced to save rather than spend during lockdowns, while house prices have continued to soar even while working hours have plummeted,” Leslie said.
Britain suffered its biggest-one year fall in output in more than 300 years in 2020 but since the start of the crisis in February 2020 total household savings had risen by £200bn, household debts (excluding credit cards) decreased by about £10bn, and house prices – which fell by an average of 22% over the previous four recessions – rose by 8%.
The thinktank report said total UK wealth had increased by £900bn to £16.5tn during the course of the pandemic, but the poorest households were more likely to have run down rather than increase their savings, and had not shared in the house price boom because they were less likely to own a home in the first place.
“As a result, the rising wealth gaps that marked pre-pandemic Britain have been turbo-charged by the crisis,” Leslie said. “With policymakers facing many tough decisions in the autumn – from protecting households as unemployment rises to paying for a decent system of social care – they can no longer afford to ignore the dominant role wealth is playing in 21st-century Britain.”
The richest fifth of households were four times as likely to have increased their savings during the crisis as the poorest fifth of households (47% versus 12%), and 2.5 times as likely to have reduced their debts. The thinktank said this reflected pandemic-induced spending reductions being concentrated among those on higher incomes.
According to the report, adults in the richest 10% of households now have wealth of £1.4m each following the £50,000 increase during the crisis, while the poorest 30% gained an average of just £86 per adult in additional wealth.
The wealth gap between the average and the wealthiest 10% of households had increased by £44,000 during the crisis (after a £350,000 increase between 2006-08 and 2016-18), the Resolution Foundation said. During the same period, the gap between the average and the poorest 10th of households had also grown, by £7,000 (a bigger increase than seen during the whole 2006-08 and 2016-18 decade).
Mubin Haq, the chief executive of Standard Life Foundation, said: “The rise in wealth for those at the bottom has been paltry even taking into account the £20 a week increase in universal credit payments to those on the lowest incomes. Wednesday’s announcement of the cut to UC risks further widening the wealth divide which ballooned during the pandemic.”
The Fund aims to provide long-term growth of capital by seeking to achieve the performance of the FTSE Developed All Cap Choice Index.
A £1,413.5m = £1.4 Billion fund.
Top Ten Holdings are:
APPLE INC. 4.4% of the fund MICROSOFT CORP. 3.6% of the fund AMAZON.COM INC. 2.8% of the fund ALPHABET INC. 2.2% of the fund FACEBOOK INC. 1.3% of the fund TESLA INC. 1.2% of the fund JPMORGAN CHASE & CO. 0.8% of the fund SAMSUNG ELECTRONICS CO. LTD. 0.8% of the fund VISA INC. 0.7% of the fund UNITEDHEALTH GROUP INC. 0.6% of the fund