Monthly Archives: December 2017

The 2017 RBS Balance Sheet

The Royal Bank of Scotland.

www.rbs.com

Reading the half year results from RBS makes intereting reading:-

https://investors.rbs.com/~/media/Files/R/RBS-IR/results-center/rbs-group-announcement-04-08-2017.pdf

Total assets of £782,654 Million (£782 Billion)

which is made up of:-

Cash and balances at central banks £86,807m
Net loans and advances to banks £20,685m
Net loans and advances to customers £326,059m
Reverse repurchase agreements and stock borrowing £40,030m
Debt securities and equity shares £86,687m
Derivatives £193,531m
Other assets £28,855m

Total £782,654 Million

That is about 50% of the annual GDP of the UK economy

Assets and Liabilities of Cisco.

Cisco is the world leading networking infrastructure supplier.

www.cisco.com

The financials of Cisco are amazing:-

https://s2.q4cdn.com/230918913/files/doc_financials/annual/2017/View-Printable-2017-Annual-Report.pdf

Look at the cash / near cash on page 68:-

Cash and cash equivalents  $ 11,708 million
Investments $ 58,784 million

That is $70,492 Million = $70 Billion

Borrowings (Debt)

Three-month LIBOR plus 0.60% February 21, 2018 $1,000m
Three-month LIBOR plus 0.31% June 15, 2018 $900m
Three-month LIBOR plus 0.50% March 1, 2019 $500m
Three-month LIBOR plus 0.34% September 20, 2019 $500m

Fixed-rate notes:
1.40% February 28, 2018 $1,250m
1.65% June 15, 2018 $1,600m
4.95% February 15, 2019 $2,000m
1.60% February 28, 2019 $1,000m
2.125% March 1, 2019 $1,750m
1.40% September 20, 2019 $1,500m
4.45% January 15, 2020 $2,500m
2.45% June 15, 2020 $1,500m
2.20% February 28, 2021 $2,500m
2.90% March 4, 2021 $500m
1.85% September 20, 2021 $500m
3.00% June 15, 2022 $500m
2.60% February 28, 2023 $500m
2.20% September 20, 2023 $750m
3.625% March 4, 2024 $1,000m
3.50% June 15, 2025 $500m
2.95% February 28, 2026 %750m
2.50% September 20, 2026 $1,500m
5.90% February 15, 2039 $2,000m
5.50% January 15, 2040 $2,000m

Total $ 30,500m = $30.5 Billion

UK Housing: The Total Value of UK Residential Properties

The Halifax (www.halifax.co.uk) produced a very interesting report on the total value of UK residential housing: £6,015 Billion

https://static.halifax.co.uk/assets/pdf/media-centre/press-releases/2017-11-29-total-value-of-housing-stock-6trillion-press-release.pdf

The total value of all the houses in the UK has passed the £6tn mark for the first time, according to The Halifax which also highlights the vast concentration of property wealth in London and the south-east. The value of homes in London is now more than all the houses in Scotland, Wales and the north of England combined. The research also reveals how property values in the south have escalated since the financial crash of 2007-08, despite incomes remaining relatively flat. In 2007 Halifax estimated that the UK’s housing stock was worth a total of £4,077bn, but over the past 10 years the figure has risen to £6.015 Trillion

To put the £6tn figure into context, it is nearly four times the size of the UK’s national debt, which is currently just over £1.8tn, and three times our total national output in 2016 (around £2tn). But even if every house in Britain was sold, the money raised would pay off less than half of the US’s national debt.

The big rises in the value of the UK’s housing stock have mostly taken place in the south. In 2007, the value of housing in the north-east was estimated at £114bn, but today it stands at £136bn – an increase of £22bn.

But in London, houses have jumped in value from £718bn in 2007 to £1,338bn today, a gain of £620bn. Over the same period the value of properties in Northern Ireland actually fell.

In total, 68% of private property wealth, amounting to £3.8tn, is concentrated in the south, up from 62% in 2007. The stock of privately owned homes in Britain also increased in number from 21.5m to 23.4m. Among the biggest gainers of property wealth in the south have been landlords and second home owners. Halifax said that while the average rate of owner-occupation in the UK was 63%, it stands at just 48% in London.

The vast majority of housing wealth is owned by the over-55s. Halifax estimated that under 35-year-olds own just 3.3% of the UK’s net property wealth, while the over-55s hold 63.3%.

Aviva PLC November 2017 Dividend

Aviva plc paid out its November dividend on the 17th Nov 2017

www.aviva.com

It paid out 8.4p a share.

http://otp.investis.com/clients/uk/avivaplc/rns/regulatory-story.aspx?cid=759&newsid=945856

The total number of voting rights in Aviva plc is 4,011,205,623

So what did the 8.4p dividend cost Aviva PLC ?

Thus:

4,011,205,623 x £0.084 = £336,941,272.33

That is £336m.

http://www.shareshop.hsbc.co.uk/shareshop/security.cgi?username=&ac=&csi=10028&record_search=1&search_phrase=aviva

That is a yield of over 4.5%.

Royal Dutch Shell’s latest acquisition

Yesterday it was announced that Royal Dutch Shell was buying the UK’s First Utility

www.shell.com

The news:-

https://www.first-utility.com/press/First-Utility-agrees-sale-of-business-to-Shell

Shell’s purchase of First Utility means, that Shell has aquired 850,000 domestic gas, electric and telecoms customers

The figures for the deal are not public but show’s how Shell is transforming itself it a domestic energy supplier.

850,000 customers, say each are paying £100 a month for Gas and Electric, imagine the new cash flow for Shell:-

£100 a month x 850,000 customers = £85,000,000 a month for Shell, that is £85m cash income a month

BP plc’s December Dividend

Today, BP plc pays out it’s December quarterly dividend.

www.bp.com

A dividend of $0.10 a share

http://otp.investis.com/clients/uk/bp_plc/rns/regulatory-story.aspx?cid=233&newsid=956941

$0.10 a share =  7.4435 pence per share.

Now, the total number of voting rights in BP p.l.c. is 19,792,111,166

http://otp.investis.com/clients/uk/bp_plc/rns/regulatory-story.aspx?cid=233&newsid=954328

Thus:-

19,792,111,166 shares x 7.4435 pence per share = £1,473,225,794.64

That is £1.473 Billion in cash paid to shareholders.

http://www.shareshop.hsbc.co.uk/shareshop/security.cgi?username=&ac=&csi=10022&record_search=1&search_phrase=bp

That is 6.1% yield.

Royal Dutch Shell: Dec 2017 Quarterly Dividend.

Tomorrow, Wednesday 20th December Royal Dutch Shell pays out its quarterly dividend.

www.shell.com

RDSA Royal Dutch Shell A FTSE 100 $0.47 (35.02p)
RDSB Royal Dutch Shell B FTSE 100 $0.47 (35.02p)

https://irssl.euroinvestor.com/asp/ir/IRM_Shell/ssl2017/NewsRead.aspx?storyid=13739543&ishtml=1

Royal Dutch Shell plc’s capital consists of 4,544,414,617 A shares and 3,745,486,731 B shares, each with equal voting rights. Royal Dutch Shell plc holds no ordinary shares in Treasury.

The total number of A shares and B shares in issue is 8,289,901,348

http://www.shareshop.hsbc.co.uk/shareshop/security.cgi?csi=133655

http://www.shareshop.hsbc.co.uk/shareshop/security.cgi?csi=133755

Now, Shell is paying out 35.02p a share thus:

The total number of A shares and B shares in issue is 8,289,901,348 x 35.02p = £2,903,123,452.07

That is £2.903 Billion. That is a yield of 5.9%

The AIM 100 Index.

The AIM 100 Index is the 100 companies listed in the London Alternative Market.

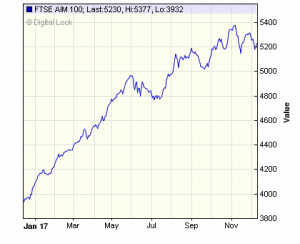
http://www.shareshop.hsbc.co.uk/shareshop/security.cgi?username=&ac=&csi=113101&record_search=1&search_phrase=aim 100

The growth in the past 12months is incredible. 20% growth, see the chart below.

aim100
The companies are:-

4d pharma PLC
Abcam PLC
accesso Technology Group PLC
Advanced Medical Solutions …
Alliance Pharma PLC
Amerisur Resources PLC
Andrews Sykes Group PLC
Applegreen PLC
Arbuthnot Banking Group PLC
ASOS PLC
Benchmark Holdings PLC
Blue Prism Group PLC
boohoo.com PLC
Breedon Group PLC
Brooks Macdonald Group PLC
Burford Capital Ltd
Camellia PLC
CareTech Holdings PLC
Central Asia Metals PLC
Clinigen Group PLC
Conviviality PLC
Craneware PLC
Crystal Amber Fund Ltd
CVS Group PLC
Dart Group PLC
dotDigital Group PLC
Eco Animal Health Group PLC
Eddie Stobart Logistics PLC
EMIS Group PLC
Falcon Oil & Gas Ltd
Faroe Petroleum PLC
Faron Pharmaceuticals Oy
Fevertree Drinks PLC
First Derivatives PLC
Frontier Developments PLC
Gamma Communications PLC
GB Group PLC
Gooch & Housego PLC
Greencoat Renewables PLC
Highland Gold Mining Ltd
Horizon Discovery Group PLC
Hotel Chocolat Group PLC
Hurricane Energy PLC
Hutchison China Meditech Ltd
IDOX PLC
IG Design Group PLC
Impellam Group PLC
Iomart Group PLC
IQE PLC
James Halstead PLC
Johnson Service Group PLC
Joules Group PLC
Keywords Studios PLC
Learning Technologies Group…
Majestic Wine PLC
Manx Telecom PLC
Mattioli Woods PLC
M&C Saatchi PLC
Midwich Group PLC
Mortgage Advice Bureau (Hol…
M P Evans Group PLC
Mulberry Group PLC
Next Fifteen Communications…
Nichols PLC
Numis Corp PLC
Oakley Capital Investments Ltd
Origin Enterprises PLC
Pan African Resources PLC
Patisserie Holdings PLC
Plus500 Ltd
Polar Capital Holdings PLC
Purplebricks Group PLC
Quixant PLC
Redde PLC
Renew Holdings PLC
Restore PLC
RhythmOne PLC
RWS Holdings PLC
SafeCharge International Gr…
Safestyle UK PLC
San Leon Energy PLC
Scapa Group PLC
Smart Metering Systems PLC
Sound Energy PLC
Staffline Group PLC
Summit Germany Ltd
Taptica International Ltd
Telford Homes PLC
Thorpe (F W) PLC
Time Out Group PLC
UK Oil & Gas Investments PLC
Vertu Motors PLC
Victoria PLC
VinaLand Ltd
Wandisco PLC
Watkin Jones PLC
Xeros Technology Group PLC
XLMedia PLC
YouGov PLC
Young & Co’s Brewery PLC

BlueZest Mortgages

BlueZest is a new lender on the UK market, financing mortgages for buy to let investors and property developers.

http://www.bluezest.com/

How are they going to finance the mortgages they advance to borrowers ?

The issuance of a bond to raise the funds:-

http://www.bluezest.com/bond-investors/

The BlueZest Secured Retail Bond PLC

http://www.londonstockexchange.com/exchange/news/market-news/market-news-detail/other/13440843.html

On the 22nd of November 2017 BlueZest Secured Retail Bond PLC, a wholly-owned subsidiary of BlueZest Funding Limited, established a £1.5bn secured retail bond programme
Thus raising £1.5b in funding from this bond, secured against the properties they lend the cash from the bond programme.

Interest rate: 5.25% Per Annum

So, raising £1,500,000,000 = £1.5 Billion: How many mortgages could this be ?

if we assume, that each mortgage is £250,000 that BlueZest advance on a property worth £300,000 so the borrow has to put down £50,000 cash deposit, in my rough example:

£1,500,000,000 (funds from the bond issue) / £250,000 (each mortgage) = 6,000 loans funded.

2 Trillion of Value: The FTSE-100

The UK Flagship index, The FTSE-100: It is worth over £2,000 Billion

AAL Anglo American   19,250.16 £Million
ABF Associated British Foods 23,342.51 £Million
ADM Admiral Group   5,503.03 £Million
AHT Ashtead Group   9,490.28 £Million
ANTO Antofagasta   8,983.62 £Million
AV. Aviva    20,467.53 £Million
AZN AstraZeneca   60,750.35 £Million
BA. BAE Systems   17,576.76 £Million
BAB Babcock International Group 3,515.16 £Million
BARC Barclays   33,032.14 £Million
BATS British American Tobacco 108,460.20 £Million
BDEV Barratt Developments  6,117.24 £Million
BKG Berkeley Group Holdings (The) 5,147.14 £Million
BLND British Land Co   6,301.10 £Million
BLT BHP Billiton   28,386.25 £Million
BNZL Bunzl    7,107.91 £Million
BP. BP    97,217.50 £Million
BRBY Burberry Group   7,311.75 £Million
BT.A BT Group   25,893.33 £Million
CCH Coca-Cola HBC   8,633.83 £Million
CCL Carnival   10,030.13 £Million
CNA Centrica   8,077.91 £Million
CPG Compass Group   23,715.10 £Million
CRDA Croda International  5,618.36 £Million
CRH CRH    21,621.31 £Million
CTEC ConvaTec Group   3,756.34 £Million
DCC DCC    6,351.10 £Million
DGE Diageo    64,036.46 £Million
DLG Direct Line Insurance Group 5,010.50 £Million
EXPN Experian   14,187.34 £Million
EZJ easyJet    5,594.68 £Million
FERG Ferguson   13,303.49 £Million
FRES Fresnillo   9,454.35 £Million
GFS G4S    3,982.17 £Million
GKN GKN    5,320.75 £Million
GLEN Glencore   48,769.38 £Million
GSK GlaxoSmithKline   62,934.53 £Million
HL. Hargreaves Lansdown  7,584.36 £Million
HMSO Hammerson   4,110.89 £Million
HSBA HSBC Holdings   147,240.09 £Million
IAG International Airlines Group 12,568.10 £Million
IHG InterContinental Hotels Group 8,197.13 £Million
III 3i Group   8,743.62 £Million
IMB Imperial Brands   29,271.43 £Million
INF Informa    6,171.80 £Million
ITRK Intertek Group   8,388.27 £Million
ITV ITV    6,432.60 £Million
JMAT Johnson Matthey   5,853.42 £Million
KGF Kingfisher   7,223.94 £Million
LAND Land Securities Group  6,906.49 £Million
LGEN Legal & General Group  15,929.22 £Million
LLOY Lloyds Banking Group ORD 47,520.05 £Million
LSE London Stock Exchange Group 13,057.54 £Million
MCRO Micro Focus International 10,765.59 £Million
MDC Mediclinic International 4,126.72 £Million
MERL Merlin Entertainments  3,601.13 £Million
MKS Marks & Spencer Group  5,079.75 £Million
MNDI Mondi    8,584.59 £Million
MRW Morrison (Wm) Supermarkets 5,081.36 £Million
NG. National Grid   29,790.22 £Million
NMC NMC Health   5,808.70 £Million
NXT Next    6,522.39 £Million
OML Old Mutual Group  9,697.31 £Million
PPB Paddy Power Betfair  7,060.91 £Million
PRU Prudential   48,136.41 £Million
PSN Persimmon   7,811.41 £Million
PSON Pearson    5,702.42 £Million
RB. Reckitt Benckiser Group  45,820.41 £Million
RBS Royal Bank of Scotland Group 33,051.67 £Million
RDSA Royal Dutch Shell  107,248.19 £Million
RDSB Royal Dutch Shell  89,723.14 £Million
REL RELX    18,392.35 £Million
RIO Rio Tinto   47,477.11 £Million
RR. Rolls-Royce Group  15,649.66 £Million
RRS Randgold Resources  6,375.82 £Million
RSA RSA Insurance Group  6,200.38 £Million
RTO Rentokil Initial  5,839.96 £Million
SBRY Sainsbury (J)   5,080.06 £Million
SDR Schroders   7,804.55 £Million
SGE Sage Group (The)  8,360.66 £Million
SGRO Segro    5,480.99 £Million
SHP Shire    33,288.00 £Million
SKG Smurfit Kappa Group  5,555.22 £Million
SKY Sky    16,085.70 £Million
SLA Standard Life Aberdeen  12,787.83 £Million
SMIN Smiths Group   5,854.27 £Million
SMT Scottish Mortgage Investment 6,312.34 £Million
SN. Smith & Nephew   11,422.90 £Million
SSE SSE    13,913.47 £Million
STAN Standard Chartered  24,290.13 £Million
STJ St James’s Place  6,393.75 £Million
SVT Severn Trent   4,943.81 £Million
TSCO Tesco    15,919.93 £Million
TUI TUI AG    7,939.69 £Million
TW. Taylor Wimpey   6,364.01 £Million
ULVR Unilever   51,474.78 £Million
UU. United Utilities Group  5,588.08 £Million
VOD Vodafone Group   59,816.01 £Million
WPG Worldpay Group   8,472.00 £Million
WPP WPP Group   16,511.60 £Million
WTB Whitbread   6,551.99 £Million

Total     £2,029,210.01 Million

That is £2.029 TRILLION: The value of the FTSE-100
HM Government November Borrowing 2017

Another month, guess what, take a lucky guess, it is the same old story, HM Government, spends more money than it receives via taxes and duties. Another deficit month, thus to bridge the gap, needs to borrow on the bond market.

In November 2017, the HM Government had to borrow money to meet the difference between tax revenues and public sector expenditure. The term for this is The PSNCR: The Public Sector Net Cash Requirement.

There were “only” 3 auctions of Gilts (UK Government Bonds) by the UK Debt Management Office (http://www.dmo.gov.uk/) to raise cash for HM Treasury:-
21-Nov-2017 0 1/8% Index-linked Treasury Gilt 2026 £1,000.0000 Million
16-Nov-2017 1¼% Treasury Gilt 2027 £2,722.3200 Million
09-Nov-2017 0¾% Treasury Gilt 2023 £2,750.0000 Million

When you add the cash raised:-

∑(£1,000.0000 Million + £2,722.3200 Million + £2,750.0000 Million) =  £6,472.32 Million

£6,472.32 Million  = £6.47232 Billion

On another way of looking at it, is in the 30 days in November, HM Government borrowed:-

£215 million each day for the 30 days.

We are fortunate, while the global banking and financial markets still has the confidence in HM Government to buy the Gilts (Lend money to the UK), the budget deficit keeps rising. What is also alarming, is the dates these bond mature 2023, 2026 and 2027. All long term borrowings, we are mortgaging our futures, but at least “We Are In It Together….