The four most dangerous words in investing are: this time it’s different.
Wise Words
Leave a reply
The four most dangerous words in investing are: this time it’s different.
Another month, guess what, take a lucky guess, it is the same old story, HM Government, spends more money than it receives via taxes and duties. Another deficit month, thus to bridge the gap, needs to borrow on the bond market.
In June 2018 , the HM Government had to borrow money to meet the difference between tax revenues and public sector expenditure. The term for this is The PSNCR: The Public Sector Net Cash Requirement.
There were “only” 3 auctions of Gilts (UK Government Bonds) by the UK Debt Management Office (http://www.dmo.gov.uk/) to raise cash for HM Treasury:-
26-Jun-2018 1¾% Treasury Gilt 2037 £2,587.4950 Million
20-Jun-2018 0 1/8% Index-linked Treasury Gilt 2028 3 months £1,381.4000 Million
06-Jun-2018 0¾% Treasury Gilt 2023 £2,750.0000 Million
When you add the cash raised:-
(2,587.4950 Million + £1,381.4000 Million + £2,750.0000 Million) = £6718.895 Million
£6718.895 Million = £6.718895 Billion
On another way of looking at it, is in the 30 days in June, HM Government borrowed:-
£223 million each day for the 30 days.
We are fortunate, while the global banking and financial markets still has the confidence in HM Government to buy the Gilts (Lend money to the UK), the budget deficit keeps rising. What is also alarming, is the dates these bond mature 2023, 2028 and 2037. All long term borrowings, we are mortgaging our futures, but at least “We Are In It Together….”
The Weiss Korea Opportunity Fund
The Weiss Korea Opportunity Fund is an investment company, that is geographically focused on investing in South Korean companies.
http://www.weisskoreaopportunityfund.com/
Top 10 Holdings
Samsung Electronics Co. 23% of the fund
LG Electronics Inc. 8% of the fund
Samsung Electro-Mechanics Co. 6% of the fund
Samsung SDI Co., Ltd. 5% of the fund
CJ CheilJedang Corp. 5% of the fund
Hyundai Motor Company. 5% of the fund
Korea Investment Holdings Co. 4% of the fund
CJ Corporation. 3% of the fund
Hyundai Motor Company. 3% of the fund
LG Household & Health Care Ltd. 3% of the fund
Top 10 Holdings 66% of the fund
http://www.shareshop.hsbc.co.uk/shareshop/security.cgi?csi=8703386&action=
The UK’s National Grid is the power transmission company of the United Kingdom.
It carries a lot of debt to fund its operations.
The current outstanding debt is £23.0 billion (2017: £19.3 billion).
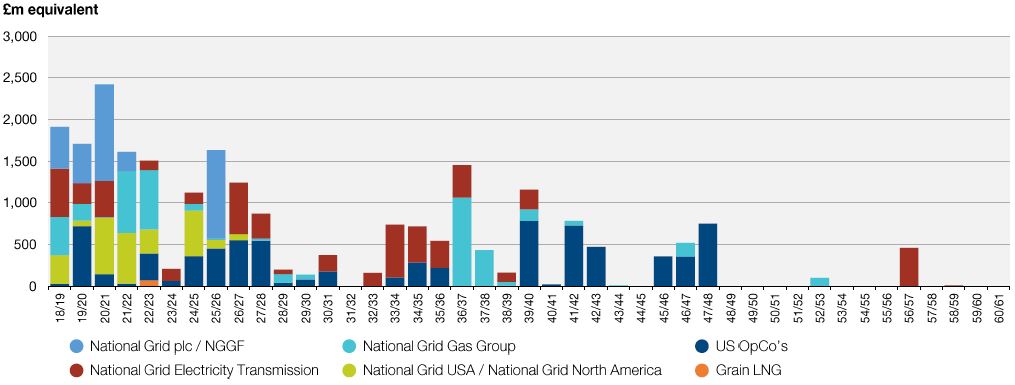
The interest payments on the debt (statutory net finance costs) were £745 million.
The effective interest rate on Treasury managed debt for the year was 4.6%
However, one has to note, that cash generated from continuing operations was £4,702 million, (£4.7 Billion)
http://www.shareshop.hsbc.co.uk/shareshop/security.cgi?csi=51261
A yield of 5%
Thames Water is the London water Utility.
www.thameswater.co.uk
It is owned by a group of investors:-
“Ontario Municipal Employees Retirement System (“OMERS”), one of Canada’s largest pension plans, and Wren House, the global direct infrastructure investment arm of the Kuwait Investment Authority, acquired the 26.3% managed stake from Macquire an Australian bank. OMERS has since agreed to increase its investment by a further 5.530%. When our recent sales complete towards the end of 2017, Thames Water will be jointly owned by 14 institutional investors – made up mostly of pension funds and sovereign wealth funds. The three largest
investors will represent pension funds – one based in Canada and two in the UK. All of our investors take a long-term view of the company’s infrastructure, its customers and the natural environment”
It carries debt to fund its business:-
a total of debt of £10,749.4 Million. That is £10.749 Billion
| Book Value Bonds including accretion Class A | 7,101.5 |
| Book Value Bonds including accretion Class B | 850.0 |
| Total Book Value Bonds including accretion | 7,951.5 |
| Class A USPP Notes | 479.1 |
| Class B USPP Notes | 119.8 |
| Class A RPI linked loans including accretion of £134.4m | 1,264.4 |
| Accretion on Index-linked Swaps | 223.3 |
| Class A Floating Rate Loans | 492.0 |
| Class A Cross-currency swaps | (78.9) |
| Class B Cross-currency swaps | (23.2) |
| Class B Loans | 179.0 |
| Less TWUL Cash Investments | (57.5) |
| TWUL Net Debt as per Compliance Certificate | 10,549.5 |
| Fees and Discounts | (75.2) |
| Intercompany Loans* | 300.0 |
| Derivative financial liabilities | (208.4) |
| Interest payable on amounts owed to group undertakings | 179.2 |
| Interest payable on secured bank loans | 4.3 |
| TWUL Net Debt as per accounts at 31 March 2017 | 10,749.4 |
| Issuer | Currency | Face Value
(currency m) |
Coupon % | Maturity Date | Class | Description | Face Value and accretion at 31 Mar 17 (£m) | |
| TWUCF | GBP | 550.0 | 5.375% | 21/07/2017* | B | Fixed Rate Bond | 550.0 | |
| TWUF | GBP | 200.0 | 5.050% | 30/06/2020 | A | Fixed Rate Bond | 200.0 | |
| TWUF | GBP | 225.0 | 6.590% | 20/04/2021 | A | Fixed Rate Bond | 225.0 | |
| TWUF | GBP | 175.0 | 3.375% | 21/07/2021 | A | RPI Linked Bond | 264.3 | |
| TWUCF | EUR | 113.0 | 2.300% | 18/07/2022 | A | CPI Linked Bond | 100.6 | |
| TWUCF | GBP | 300.0 | 5.750% | 13/09/2030 | B | Fixed Rate Bond | 300.0 | |
| TWUCF | GBP | 500.0 | 4.000% | 19/06/2025 | A | Fixed Rate Bond | 500.0 | |
| TWUCF | GBP | 45.0 | 0.721% | 21/12/2027 | A | RPI Linked Bond | 46.0 | |
| TWUCF | GBP | 300.0 | 3.5% | 25/02/2028 | A | Fixed Rate Bond | 300.0 | |
| TWUF | GBP | 330.0 | 6.750% | 16/11/2028 | A | Fixed Rate Bond | 330.0 | |
| TWUF | GBP | 200.0 | 6.500% | 09/02/2032 | A | Fixed Rate Bond | 200.0 | |
| TWUCF | GBP | 300.0 | 4.375% | 03/07/2034 | A | Fixed Rate Bond | 300.0 | |
| TWUCF | GBP | 40.0 | 0.75% | 18/12/2034 | A | RPI Linked Bond | 40.9 | |
| TWUF | GBP | 600.0 | 5.125% | 28/09/2037 | A | Fixed Rate Bond | 600.0 | |
| TWUCF | JPY | 20,000.0 | 3.280% | 20/08/2038 | A | Fixed Rate Bond | 143.3 | |
| TWUCF | GBP | 50.0 | 3.853% | 15/12/2040 | A | LPI Linked Bond | 60.9 | |
| TWUCF | GBP | 500.0 | 5.500% | 11/02/2041 | A | Fixed Rate Bond | 500.0 | |
| TWUCF | GBP | 50.0 | 1.980% | 28/08/2042 | A | RPI Linked Bond | 64.4 | |
| TWUCF | GBP | 55.0 | 2.091% | 06/10/2042 | A | RPI Linked Bond | 68.4 | |
| TWUCF | GBP | 40.0 | 1.974% | 12/10/2045 | A | RPI Linked Bond | 45.7 | |
| TWUCF | GBP | 300.0 | 4.625% | 04/06/2046 | A | Fixed Rate Bond | 300.0 | |
| TWUCF | GBP | 100.0 | 1.846% | 28/08/2047 | A | RPI Linked Bond | 128.9 | |
| TWUCF | GBP | 200.0 | 1.819% | 28/08/2049 | A | RPI Linked Bond | 257.8 | |
| TWUF | GBP | 300.0 | 1.680% | 11/07/2053 | A | RPI Linked Bond | 408.2 | |
| TWUF | GBP | 300.0 | 1.681% | 11/07/2055 | A | RPI Linked Bond | 408.2 | |
| TWUCF | GBP | 200.0 | 1.771% | 28/08/2057 | A | RPI Linked Bond | 257.8 | |
| TWUCF | GBP | 400.0 | 7.738% | 09/04/2058 | A | Fixed Rate Bond | 400.0 | |
| TWUCF | GBP | 350.0 | 1.760% | 28/08/2062 | A | RPI Linked Bond | 451.1 | |
| TWUCF | GBP | 250.0 | 1.875% | 24/01/2024 | A | Fixed Rate Bond | 250.0 | |
| TWUCF | GBP | 250.0 | 2.625% | 24/01/2032 | A | Fixed Rate Bond | 250.0 | |
| Total | 7,951.5
|
|||||||
Today the FTSE-100, the UK Flagship Index of the UK’s largest 100 companies is worth a lot of money.
£2,129,423.22 Million to be precise.
That is £2.129 TRILLION. That figure is larger than UK GDP.
101 companies because of the dual listing for Royal Dutch Shell, which trades as Royal Dutch Shell “A” and Royal Dutch Shell “B”
| Position | Symbol | Company | Market Capitalisation £m |
| 1 | HSBA | HSBC Holdings | £142,052.77 |
| 2 | RDSA | Royal Dutch Shell A | £120,008.21 |
| 3 | BP. | BP | £115,576.52 |
| 4 | RDSB | Royal Dutch Shell B | £100,716.11 |
| 5 | BATS | British American Tobacco | £87,849.26 |
| 6 | GSK | GlaxoSmithKline | £75,870.76 |
| 7 | DGE | Diageo | £66,984.00 |
| 8 | AZN | AstraZeneca | £66,536.99 |
| 9 | RIO | Rio Tinto | £55,246.45 |
| 10 | GLEN | Glencore | £52,217.56 |
| 11 | ULVR | Unilever | £50,680.14 |
| 12 | VOD | Vodafone | £49,036.85 |
| 13 | LLOY | Lloyds Banking Group | £45,474.30 |
| 14 | PRU | Prudential | £44,955.83 |
| 15 | RB. | Reckitt Benckiser Group | £44,052.37 |
| 16 | SHP | Shire | £38,982.71 |
| 17 | BLT | BHP Billiton | £36,030.68 |
| 18 | BARC | Barclays | £32,335.08 |
| 19 | RBS | Royal Bank of Scotland Group | £30,801.96 |
| 20 | NG. | National Grid | £28,141.47 |
| 21 | IMB | Imperial Brands | £26,914.46 |
| 22 | CPG | Compass Group | £25,631.83 |
| 23 | TSCO | Tesco | £25,261.01 |
| 24 | SKY | Sky | £25,123.44 |
| 25 | AAL | Anglo American | £23,808.03 |
| 26 | STAN | Standard Chartered | £23,141.48 |
| 27 | CRH | CRH | £22,394.66 |
| 28 | ABF | Associated British Foods | £21,676.04 |
| 29 | BT.A | BT Group | £21,609.90 |
| 30 | BA. | BAE Systems | £20,652.56 |
| 31 | AV. | Aviva | £20,351.60 |
| 32 | RR. | Rolls-Royce Holdings | £18,475.16 |
| 33 | EXPN | Experian | £17,198.38 |
| 34 | REL | RELX | £16,988.15 |
| 35 | LGEN | Legal & General Group | £15,850.56 |
| 36 | LSE | London Stock Exchange Group | £15,558.49 |
| 37 | WPP | WPP | £15,052.46 |
| 38 | FERG | Ferguson | £14,255.63 |
| 39 | SSE | SSE | £13,755.76 |
| 40 | IAG | International Consolidated Airlines | £13,490.74 |
| 41 | SN. | Smith & Nephew | £12,225.21 |
| 42 | RRS | Randgold Resources | £11,425.01 |
| 43 | AHT | Ashtead Group | £11,115.20 |
| 44 | INF | Informa | £10,450.37 |
| 45 | MRO | Melrose Industries | £10,179.66 |
| 46 | TUI | TUI AG | £9,765.31 |
| 47 | ANTO | Antofagasta | £9,759.98 |
| 48 | SLA | Standard Life Aberdeen | £9,704.01 |
| 49 | HL. | Hargreaves Lansdown | £9,351.19 |
| 50 | CCH | Coca Cola HBC AG | £9,317.48 |
| 51 | ITRK | Intertek Group | £9,225.23 |
| 52 | BRBY | Burberry Group | £9,028.27 |
| 53 | IHG | InterContinental Hotels Group | £8,999.62 |
| 54 | CCL | Carnival | £8,933.55 |
| 55 | CNA | Centrica | £8,894.88 |
| 56 | III | 3i Group | £8,762.00 |
| 57 | SDR | Schroders | £8,541.95 |
| 58 | NXT | Next | £8,507.67 |
| 59 | FRES | Fresnillo | £8,426.38 |
| 60 | PSN | Persimmon | £7,885.55 |
| 61 | BNZL | Bunzl | £7,716.97 |
| 62 | SMT | Scottish Mortgage Investment Trust | £7,547.63 |
| 63 | MNDI | Mondi | £7,532.11 |
| 64 | NMC | NMC Health | £7,458.11 |
| 65 | EVR | Evraz | £7,338.00 |
| 66 | SKG | Smurfit Kappa Group | £7,272.91 |
| 67 | WTB | Whitbread | £7,268.77 |
| 68 | OCDO | Ocado Group | £7,166.75 |
| 69 | RSA | RSA Insurance Group | £7,137.38 |
| 70 | LAND | Land Securities Group | £7,095.03 |
| 71 | SBRY | Sainsbury (J) | £7,065.51 |
| 72 | ITV | ITV | £7,004.21 |
| 73 | JMAT | Johnson Matthey | £7,003.97 |
| 74 | PPB | Paddy Power Betfair | £6,953.87 |
| 75 | PSON | Pearson | £6,908.93 |
| 76 | SGE | Sage Group | £6,811.02 |
| 77 | SGRO | Segro | £6,771.34 |
| 78 | SMIN | Smiths Group | £6,720.00 |
| 79 | EZJ | Easyjet | £6,645.29 |
| 80 | BLND | British Land | £6,602.15 |
| 81 | RTO | Rentokil Initial | £6,466.41 |
| 82 | KGF | Kingfisher | £6,340.13 |
| 83 | CRDA | Croda International | £6,321.50 |
| 84 | DCC | DCC | £6,158.74 |
| 85 | GVC | GVC Holdings | £6,074.96 |
| 86 | STJ | St. James’s Place | £6,073.72 |
| 87 | MRW | Morrison (Wm) Supermarkets | £5,936.99 |
| 88 | TW. | Taylor Wimpey | £5,861.90 |
| 89 | MCRO | Micro Focus International | £5,774.67 |
| 90 | SMDS | Smith (DS) | £5,600.61 |
| 91 | ADM | Admiral Group | £5,488.66 |
| 92 | JE. | Just Eat | £5,302.28 |
| 93 | BDEV | Barratt Developments | £5,218.67 |
| 94 | UU. | United Utilities Group | £5,204.17 |
| 95 | HLMA | Halma | £5,201.09 |
| 96 | BKG | Berkeley Group Holdings | £5,077.83 |
| 97 | RMG | Royal Mail | £5,054.00 |
| 98 | RMV | Rightmove | £4,810.83 |
| 99 | MKS | Marks & Spencer Group | £4,794.72 |
| 100 | DLG | Direct Line Insurance Group | £4,714.88 |
| 101 | SVT | Severn Trent | £4,687.63 |
| £2,129,423.22 |
The Legal & General Global Infrastructure Index Fund targets companies that own, operate, manage or maintain essential infrastructure across a range of sectors, including utilities, industrials, and oil and gas.
a £250m fund
http://www.lgim.com/files/_document-library/adviser/global-infrastructure-index-fund-profile.pdf
Top 10 Holdings %
Union Pacific Corp 5.95% of the fund
Nextera Energy Inc 4.30% of the fund
American Tower Corp 3.45% of the fund
Canadian National Railway 3.09% of the fund
Duke Energy Corp 3.06% of the fund
Enbridge 2.92% of the fund
CSX Corp 2.67% of the fund
Southern Co 2.50% of the fund
Crown Castle Intl Corp 2.48% of the fund
Dominion Energy 2.43% of the fund
Total 32.85% of the fund are the top 10 holdings.
Public sector net debt, excluding public sector banks, is £1,781.4bn that is equivalent to 85% of GDP.
Or with 60m people in the UK, that is about £30,000 per person in the UK.

https://www.youtube.com/watch?v=tqTOZLd3Cjw
The JPMorgan Global Growth & Income plc is a London listed investment trust.
The objective of the fund is to deliver total returns and outperform the MSCI All Country World Index over the long-term by investing in companies based around the world. The Company makes quarterly dividends.
10 Largest Holdings are:
Alphabet 4.4% of the fund
Microsoft Technology 2.8% of the fund
United Health Group 2.8% of the fund
Prudential 2.0% of the fund
Pioneer Natural Resources 1.9% of the fund
Union Pacific 1.7% of the fund
Visa 1.6% of the fund
Standard Chartered 1.6% of the fund
Citigroup 1.6% of the fund
O Reilly Auto Parts 1.5% of the fund
2% yield.
Warren Buffet quote:-
“Cash combined with courage in a time of crisis is priceless.”

Vodafone.
Carries a lot of debt.
http://www.vodafone.com/content/index/investors/debt_investors.html#
Reading the annual report you see it has revenues of £41,649.80 Million = £41.6Bn.
The level of debt is very interesting:-
The Debt of Vodafone 2017:- €m €m €m
Short-Term Long-Term Total
Bank loans: 867 2,741 3,608
Bonds: 660 19,345 20,005
Other liabilities: 4,632 305 4,937
Bonds in designated hedge relationships 2,244 12,132 14,37
Total: 12,051 34,523 46,574
That is €m 46,574 = £40,725.5 = £40.725 Bn
The The Diverse Income Trust plc is a London Listed £400 investment trust.
https://www.mitongroup.com/private/fund/the-diverse-income-trust-plc/
The Company invests primarily in quoted or traded UK companies with a wide range of market capitalisations, but a long-term bias toward small and medium sized companies. The Company may also invest in large companies, including FTSE 100 Index constituents
Top 20 Holdings are:-
Zotefoams plc 2.2% of the fund
2.Stobart Group Ltd 2.1% of the fund
3.Charles Taylor plc 2.0% of the fund
4.SafeCharge International Group Ltd 1.8% of the fund
5.Amino Technologies 1.6% of the fund
6.A&J Mucklow Group plc 1.5% of the fund
7.Royal Dutch Shell plc* 1.4% of the fund
8.Randall & Quilter Investment Holdings 1.3% of the fund
9.CML Microsystems plc 1.3% of the fund
10.K3 Capital Group plc 1.3% of the fund
11.FTSE Put Option 20/09/19 1.3% of the fund
12.International Greetings plc 1.2% of the fund
13.Smurfit Kappa Group plc 1.2% of the fund
14.PJSC Polyus GDR 1.2% of the fund
15.Sainsbury plc 1.2% of the fund
16.Aviva plc 1.2% of the fund
17.Rio Tinto plc 1.2% of the fund
18.Morses Club plc 1.2% of the fund
19.BP plc 1.1% of the fund
20.Legal & General Group plc 1.1% of the fund
http://www.shareshop.hsbc.co.uk/shareshop/security.cgi?csi=2543596&action=
A 2.8% yield.
The EP Global Opportunities Trust plc is a £130m London listed investment.
https://www.edinburghpartners.com/investment-trusts/ep-global-opportunities-trust-plc/documents
The Company’s objective is to provide Shareholders with an attractive real long-term total return by investing globally in undervalued securities.
Top 10 Holdings
Roche Holdings Health Care 3.3% of the fund
Astrazeneca Health Care 3.2% of the fund
BP Oil & Gas 3.1% of the fund
Tesco Retail 3.1% of the fund
Verizon Communications Inc Telecoms 3.0% of the fund
Sumitomo Mitsui Trust Banks 2.9% of the fund
Panasonic Personal & Household Goods 2.9% of the fund
ENI Oil & Gas 2.9% of the fund
Total Oil & Gas 2.7% of the fund
Sumitomo Mitsui Financial Group Banks 2.7% of the fund
http://www.shareshop.hsbc.co.uk/shareshop/security.cgi?csi=54096
TwentyFour Select Monthly Income Fund is a London listed closed-ended fund which is designed to take advantage of the premium returns available from “less liquid” instruments across the debt spectrum.
https://twentyfouram.com/funds/twentyfour-select-monthly-income-fund/
It’s top ten holdings are:-
NATIONWIDE BLDG 10.25 PERP Banks 3.72% of whole fund
BRACKEN MIDCO 10.5 15/11/2021 High Yield – EU 2.63% of whole fund
SHAWBROOK GROUP 7.875 PERP Banks 2.54% of whole fund
COVENTRY BDG SOC 6.375 PERP Banks 2.28% of whole fund
SANTANDER UK PLC 10.375 PERP Banks 2.15% of whole fund
ALDERMORE 11.875 PERP Banks 1.83% of whole fund
ARBR 3X FR ABS 1.68% of whole fund
OPTOM 3 MEZZ ABS 1.67% of whole fund
BANCO BILBAO VIZ 8.875 PERP Banks 1.63% of whole fund
CBFLU 1 MEZZ ABS 1.56% of whole fund
http://www.shareshop.hsbc.co.uk/shareshop/security.cgi?csi=26656574
6.6% yield, paying 0.5p out a month.
Tomorrow, BP PLC one of the oil majors pays out its quarterly dividend of 7.4435p a share.
What does this dividend cost ?
https://otp.investis.com/clients/uk/bp_plc/rns/regulatory-story.aspx?cid=233&newsid=1036742
The total number of voting rights in BP p.l.c. is 19,954,945,428
Thus:-19,954,945,428
19,954,945,428 x £0.074435 = £1,485,346,362.93
That is £1.485 Billion.
A yield of 5.1%
https://www.youtube.com/watch?v=7g_d-phoUrU
Tomorrow, Royal Dutch Shell pays out its quarterly dividend.
RDSA Royal Dutch Shell A $0.47 (35.18p)
RDSB Royal Dutch Shell B $0.47 (35.18p)
£0.3518 a share.
https://irssl.euroinvestor.com/asp/ir/IRM_Shell/ssl2017/NewsRead.aspx?storyid=13939519&ishtml=1
Royal Dutch Shell plc’s capital consists of 4,597,136,050 A shares and 3,745,486,731 B shares, each with equal voting rights.
Thus:
4,597,136,050 x £0.3518 = £1,617,272,462.39
3,745,486,731 x £0.3518 = £1,317,662,231.97
That is:-
£1,617,272,462.39 + 1,317,662,231.97 = £2,934,934,694.36
That is £2.934 Billion of cash.
http://www.shareshop.hsbc.co.uk/shareshop/security.cgi?csi=133655
http://www.shareshop.hsbc.co.uk/shareshop/security.cgi?csi=133755
That is over a 5% yield.
The ETFS Battery Value-Chain GO UCITS ETF is a London Listed Exchange Traded Fund
It is now known as the L&G Battery Value-Chain UCITS ETF
The fund is investing in technology companies in the Battery sector. The ETFS Battery Value-Chain GO UCITS ETF (BATT) is designed to track the performance of the Solactive Battery Value-Chain Index.The Index aims to track the performance of a basket of stocks of companies that are providers of certain electro-chemical energy storage technologies and mining companies that produce metals used to manufacture batteries.
Ten Top Holdings
1 OROCOBRE LTD 4.39% of the fund
2 TOSHIBA CORP ORD 4.26% of the fund
3 TESLA INC 4.26% of the fund
4 NIDEC CORP ORD 4.25% of the fund
5 NEC CORP ORD 4.25% of the fund
6 GS YUASA CORP 4.17% of the fund
7 SONY CORP 4.14% of the fund
8 NISSAN MOTOR CO LTD ORD 4.11% of the fund
9 ENERSYS 3.91% of the fund
10 PANASONIC CORP 3.83% of the fund
https://www.youtube.com/watch?v=AQedOz_Hsv8
I want to trip inside your head
Spend the day there
To hear the things you haven’t said
And see what you might see
I want to hear you when you call
Do you feel anything at all?
I want to see your thoughts take shape and walk right out
Freedom has a scent
Like the top of a newborn baby’s head
The songs are in your eyes
I see them when you smile
I’ve seen enough, I’m not giving up on a miracle drug
Of science and the human heart
There is no limit
There is no failure here, sweetheart
Just when you quit
I am you and you are mine
Love makes nonsense of space and time, will disappear
Love and logic keep us clear
Reason is on our side, love
The songs are in your eyes
I see them when you smile
I’ve had enough of romantic love
I’d give it up, yeah, I’d give it up
For a…
British Telecommunications PLC is the world’s leading Telecommunications and Media organisation. It is the UK’s premier company.
The yield today on BT shares is now at 5%
http://www.shareshop.hsbc.co.uk/shareshop/security.cgi?csi=10025&action=
BT. Be There.
Today, the Insurer and Investment Management giant, Legal and General paid out it’s June 2018 Dividend.
11.05p a share.
The total number of voting rights in the Company is 5,958,820,443
https://ir.euroinvestor.com/solutions/LegalAndGeneralGroup/3726/newsArticle.aspx?storyid=13904793
Thus:-
5,958,820,443 x £0.1105 = £658,449,658.95
that is £658million in cash.
http://www.shareshop.hsbc.co.uk/shareshop/security.cgi?csi=10055&action=
5.7% yield.
Another month, guess what, take a lucky guess, it is the same old story, HM Government, spends more money than it receives via taxes and duties. Another deficit month, thus to bridge the gap, needs to borrow on the bond market.
In May 2018 , the HM Government had to borrow money to meet the difference between tax revenues and public sector expenditure. The term for this is The PSNCR: The Public Sector Net Cash Requirement.
There were “only” 3 auctions of Gilts (UK Government Bonds) by the UK Debt Management Office (http://www.dmo.gov.uk/) to raise cash for HM Treasury:-
24-May-2018 0 1/8% Index-linked Treasury Gilt 2036 3 months 1,146.8740 Million
09-May-2018 1 5/8% Treasury Gilt 2028 2,810.0810 Million
03-May-2018 0¾% Treasury Gilt 2023 3,427.0340 Million
When you add the cash raised:-
(£1,146.8740 Million + £2,810.0810 Million + £3,427.0340 Million) = £7383.989 Million
£7383.989 Million = £7.383989 Billion
On another way of looking at it, is in the 31 days in May, HM Government borrowed:-
£238 million each day for the 31 days.
We are fortunate, while the global banking and financial markets still has the confidence in HM Government to buy the Gilts (Lend money to the UK), the budget deficit keeps rising. What is also alarming, is the dates these bond mature 2023, 2028 and 2036. All long term borrowings, we are mortgaging our futures, but at least “We Are In It Together….”
“Investors should be skeptical of history-based models. Constructed by a nerdy-sounding priesthood using esoteric terms such as beta, gamma, sigma and the like, these models tend to look impressive. Too often, though, investors forget to examine the assumptions behind the models. Beware of geeks bearing formulas. ”
Yesterday, the money manager, Standard Life Aberdeen paid out is May dividend.
14.3p per share.
https://www.standardlifeaberdeen.com/
The total number of voting rights in the Company, as at 30 April 2018, is therefore 2,979,383,303
http://www.londonstockexchange.com/exchange/news/market-news/market-news-detail/SLA/13626025.html
Thus the cost of the dividend:-
2,979,383,303 x 14.3p = £426,051,812.33
That is £426 million in cash.
http://www.shareshop.hsbc.co.uk/shareshop/security.cgi?csi=186960
A yield of 5.9%
The Lloyds Banking Group Dividend of 2.05 pence was paid today.
The total number of shares issued by Lloyds Banking Group plc with rights to vote which are exercisable in all circumstances at general meetings is 71,992,041,055 ordinary shares of 10p
Thus the cost of the dividend:
71,992,041,055 x £0.0205 = £1,475,836,841.63
That is £1,475 Million = £1.475 Billion
http://www.shareshop.hsbc.co.uk/shareshop/security.cgi?csi=10056&action=
A yield of 4.6%
The Invesco Enhanced Income Limited is currently in a situation where the fund manager Invesco Perpetual has quit running the fund due to a dispute in management fees.
A £150m London Listed Investment Trust.
https://www.invescoperpetual.co.uk/uk/products/invesco-perpetual-enhanced-income-limited
The investment trust’s principal objective is to provide shareholders with a high level of income whilst seeking to maximise total return through investing in a diversified portfolio of high
yielding corporate and government bonds. The portfolio holds a core (around 47%) of non-financial high yield corporate bonds,focused on seasoned issuers that are considered have a low likelihood of default.
Top 10 holdings are:-
UniCredit International Bank 8.5925% FRN Perpetual, 8.125% FRN Perpetual 2.3% portfolio
Origin Energy 7.875% 16 Jun 2071 2.1% portfolio
Virgin Media Finance 7.0% 15 Apr 2023 (SNR), 5.125% 15 Jan 2025 (SNR) 2.0% portfolio
Premier Foods Finance FRN 15 Jul 2022 (SNR), 6.5% 15 Mar 2021 (SNR) 1.8% portfolio
NWEN Finance 5.875% 21 Jun 2021 (SNR) 1.8% portfolio
Standard Chartered 5.7% 26 Mar 2044, 5.125% 06 Jun 2034 1.8% portfolio
Enterprise Inns 6.5% 06 Dec 2018 (SNR), 6.375% 15 Feb 2022 (SNR) 1.8% portfolio
Société Genérale 8.875% FRN Perpetual, 7.875% FRN Perpetual 1.7% portfolio
Enel 7.75% 10 Sep 2075, 6.625% 15 Sep 2076 1.7% portfolio
NGG Finance 5.625% FRN 18 Jun 2073 1.7% portfolio
Total 18.7% portfolio
a yield of 6%
Another month, guess what, take a lucky guess, it is the same old story, HM Government, spends more money than it receives via taxes and duties. Another deficit month, thus to bridge the gap, needs to borrow on the bond market.
In April 2018 , the HM Government had to borrow money to meet the difference between tax revenues and public sector expenditure. The term for this is The PSNCR: The Public Sector Net Cash Requirement.
There were “only” 4 auctions of Gilts (UK Government Bonds) by the UK Debt Management Office (http://www.dmo.gov.uk/) to raise cash for HM Treasury:-
24-Apr-2018 0 1/8% Index-linked Treasury Gilt 2048 3 months £750.0000 Million
19-Apr-2018 1 5/8% Treasury Gilt 2028 £2,500.0000 Million
10-Apr-2018 1¾% Treasury Gilt 2057 £2,185.1600 Million
04-Apr-2018 0¾% Treasury Gilt 2023 £2,750.0000 Million
When you add the cash raised:-
(£750.0000 Million + £2,500.0000 Million + £2,185.1600 Million + £2,750.0000 Million) = £8185.16 Million
£8185.16 Million = £8.18516 Billion
On another way of looking at it, is in the 30 days in April, HM Government borrowed:-
£272 million each day for the 30 days.
We are fortunate, while the global banking and financial markets still has the confidence in HM Government to buy the Gilts (Lend money to the UK), the budget deficit keeps rising. What is also alarming, is the dates these bond mature 2023, 2028, 2048 and 2057. All long term borrowings, we are mortgaging our futures, but at least “We Are In It Together….”
The Sequoia Economic Infrastructure Income Fund Limited is a fund investing in core infrastructure. It is a debt investing vehicle.
The Fund focuses primarily on taking subordinated and select senior debt exposures to economic infrastructure projects, companies and special purpose vehicles
The 15 largest settled investments:-
Hawaiki Mezzanine Loan USD Private Mezz £49.2m TMT Undersea cable 11.9% yield
A’lienor S.A.S. (A65) EUR Private Senior £39.4m Transport Road 5.0% yield
Active Assistance GBP Private Senior £36.4m Accomm. Health care 8.4% yield
Tracy Hills TL 2025 USD Private Senior £34.2m Other Residential infra 10.3% yield
Cory Environmental GBP Private HoldCo £31.3m Utility Waste-to-energy 8.5% yield
Bulb Energy Senior Secured GBP Private Senior £26.9m Utility Electricity supply 9.0% yield
Warnow Tunnel EUR Private Senior £25.1m Transport Road 6.8% yield
Aquaventure USD Private Senior £25.0m Utility Water 7.7% yield
Abteen Ventures USD Private Senior £24.9m TMT Data centers 8.0% yield
Terra-Gen Power TL B USD Private Senior £22.4m Renewables Solar & wind 9.5% yield
Natgasoline USD Private Mezz £20.6m Other Industrial infra 10.0% yield
Exeltium Mezzanine EUR Private Mezz £19.3m Power PPA 9.4% yield
Welcome Break No.1 Ltd GBP Private Mezz £18.3m Transport Motorway services 8.5% yield
Clyde Street Glasgow GBP Private Senior £18.3m Accomm. Student housing 8.0% yield
Neoen Production EUR Private HoldCo £15.4m Renewables Solar & wind 7.0% yield
http://www.shareshop.hsbc.co.uk/shareshop/security.cgi?csi=39587556&action=
Launched in 1868, The Foreign and Colonial Investment Trust is a highly regarding investment trust.
Philip Rose founded F&C Investment Trust alongside barrister Samuel Laing, and Samuel Laing’s business partner James Thompson Mackenzie, who was also Deputy Chairman of the East Bengal Railway. With the backing of influential politician Lord Westbury, F&C Investment Trust was launched on Thursday 19 March 1868. Today F&C Investment Trust has total assets of £4 billion (as at 31 December 2017), diversified across global holdings from over 30 different countries.
It has grown its dividend every year for the past 47 years
Foreign & Colonial Investment top 50 holdings:-
AMAZON.COM INC
MICROSOFT CORP
UNITEDHEALTH GROUP INC
FACEBOOK INC A
ANTHEM INC
UTILICO EMERGING MARKETS LTD
ALPHABET INC CL C
JPMORGAN CHASE + CO
PANTHEON EUROPE V A LP
ALIBABA GROUP HOLDING SP ADR
INTESA SANPAOLO
CITIGROUP INC
STATE STREET CORP
PRICELINE GROUP INC/THE
LOWE S COS INC
ARTEMIS US EXTENDED ALPHA FUND
APPLE INC
CONVENTUM LYRICAL FUND
ROYAL DUTCH SHELL PLC B SHS
BOEING CO/THE
VISA INC CLASS A SHARES
UBS GROUP AG REG
PFIZER INC
BANK MANDIRI PERSERO TBK PT
ISHARES CORE MSCI EM IMI UCITS
NOVO NORDISK A/S B
ING GROEP NV
CHEVRON CORP
CANON INC
SYNCONA LTD
CVS HEALTH CORP
DOWDUPONT INC
WELLS FARGO + CO
COMCAST CORP CLASS A
SANDS CHINA LTD
ORACLE CORP
HARBOURVEST PART. VIII BUYOUT
ASML HOLDING NV
BP PLC SPONS ADR
MASTERCARD INC A
FINDLAY PARK AMERICAN FUND
BAYER AG REG
PHILIP MORRIS INTERNATIONAL
QUALCOMM INC
SAP SE
MORGAN STANLEY
ALLIANZ SE REG
HARBOURVEST PART VIII VENTURE
WALMART DE MEXICO SAB DE CV
PANTHEON ASIA FUND V
https://www.youtube.com/watch?v=1YA836GcWBo
The Premier Global Infrastructure Trust is a London listed investment trust.
The fund will seek to achieve its objectives by investing principally in equity and equity-related securities of companies operating in the energy and water sectors, as well as other infrastructure investments.
Top 10 holdings are:-
Cia de Saneamento do Parana Latin America
First Trust MLP and Energy Income Fund North America
China Everbright International China Growth
SSE United Kingdom Yield
Huaneng Renewables China Growth
Avangrid North America Yield
NRG Yield * North America
Beijing Enterprises Holdings China Growth
Atlantia E u r o p e ( e x cluding UK)
DP World Middle East Growth
http://www.shareshop.hsbc.co.uk/shareshop/security.cgi?csi=53460&action=
A yield of over 7%
The MSCI Emerging Markets Index is made up of companies in the Emerging Markets world. The component companies are:-
TENCENT HOLDINGS LI (CN) 5.369088%
SAMSUNG ELECTRONICS CO 4.353278%
ALIBABA GROUP HLDG ADR 3.846781%
TAIWAN SEMICONDUCTOR MFG 3.623682%
NASPERS N 2.148970%
CHINA CONSTRUCTION BK H 1.402290%
BAIDU ADR 1.232323%
CHINA MOBILE 1.184509%
ICBC H 1.097664%
HON HAI PRECISION IND CO 0.984212%
PING AN INSURANCE H 0.963201%
SK HYNIX 0.793184%
ITAU UNIBANCO PN 0.781257%
SBERBANK RUSSIA COM(RUB) 0.780627%
HOUSING DEV FINANCE CORP 0.744323%
BANK OF CHINA H 0.740674%
RELIANCE INDUSTRIES 0.701894%
VALE ON 0.659841%
SAMSUNG ELECTRONICS PREF 0.645329%
BANCO BRADESCO PN 0.583522%
AMBEV ON (NEW) 0.565592%
AMERICA MOVIL L 0.546767%
INFOSYS 0.522310%
NETEASE COM ADR 0.490737%
CNOOC 0.467625%
JD.COM ADR 0.467522%
LUKOIL HOLDING(RUB) 0.464357%
GAZPROM (RUB) 0.462702%
CHINA LIFE INSURANCE H 0.460701%
HYUNDAI MOTOR CO 0.438176%
POSCO 0.428367%
NAVER 0.409688%
KB FINANCIAL GROUP 0.407469%
PETROBRAS PN 0.359046%
TATA CONSULTANCY 0.358196%
SHINHAN FINANCIAL GROUP 0.353700%
CTRIP COM INTL ADR 0.347737%
CHINA PETRO & CHEM H 0.344015%
FEMSA UNIT UBD 0.342701%
LG CHEM 0.332643%
SASOL 0.332109%
GEELY AUTOMOBILE HLDGS 0.331300%
HYUNDAI MOBIS 0.322529%
LARGAN PRECISION CO 0.320969%
STANDARD BANK GROUP 0.315343%
MTN GROUP 0.302500%
MEDIATEK INC 0.301449%
YUM CHINA HOLDINGS 0.297279%
CELLTRION 0.296513%
TELEKOMUNIKASI INDONESIA 0.295590%
CHINA MERCHANTS BANK H 0.288390%
BANK CENTRAL ASIA 0.283622%
GRUPO FIN BANORTE O 0.282651%
CATHAY FINANCIAL HOLDING 0.282371%
PETROBRAS ON 0.281303%
BM&F BOVESPA ON 0.278031%
AAC TECHNOLOGIES (CN) 0.275236%
CREDICORP 0.273731%
PUBLIC BANK 0.270829%
PETROCHINA CO H 0.270550%
MARUTI SUZUKI INDIA 0.269835%
AXIS BANK 0.265610%
FIRSTRAND 0.264482%
PTT 0.260146%
ITC 0.258019%
BANK RAKYAT INDONESIA 0.251798%
CHUNGHWA TELECOM CO 0.251741%
KT&G CORP(KOREA TOBACCO) 0.248463%
TENAGA NASIONAL 0.245364%
FORMOSA PLASTIC CORP 0.244521%
ITAUSA PN 0.242504%
HINDUSTAN UNILEVER 0.240721%
CHINA PACIFIC INS GRP H 0.238399%
HANA FINANCIAL HOLDINGS 0.237765%
WALMART MEXICO V 0.235760%
STEINHOFF NV 0.233757%
CHINA OVERSEAS LAND &INV 0.233660%
AGRI BANK OF CHINA H 0.231458%
SK INNOVATION CO 0.230629%
SUNNY OPTICAL TECH 0.230330%
TATNEFT COMMON (RUB) 0.228941%
ASTRA INTERNATIONAL 0.228134%
CTBC FINANCIAL HOLDING 0.227395%
NAN YA PLASTIC 0.227267%
GRUPO MEXICO B 0.227129%
NEW ORIENTAL EDUCAT ADR 0.215915%
FUBON FINANCIAL HOLDING 0.215608%
ICICI BANK 0.214787%
CP ALL PCL 0.212833%
PKO BANK POLSKI 0.212258%
CEMEX CPO 0.209324%
CHINA EVERGRANDE GROUP 0.209253%
NORILSK NICKEL MMC(RUB) 0.208334%
SAMSUNG SDI CO 0.207631%
NOVATEK GDR 0.200585%
LG HOUSEHOLD & HEALTH 0.199349%
UNI-PRESIDENT ENT. 0.197760%
CHINA STEEL CORP COMMON 0.195992%
BANK MANDIRI 0.195213%
TATA MOTORS 0.187794%
MALAYAN BANKING 0.182833%
CSPC PHARMACEUTICAL GRP 0.177601%
SAMSUNG C&T CORPORATION 0.177569%
AMOREPACIFIC CORP (NEW) 0.176795%
FORMOSA CHEMICALS FIBRE 0.175984%
MAGNIT GDR 0.175966%
SUNAC CHINA HOLDINGS 0.175952%
LG ELECTRONICS (NEW) 0.175003%
POLSKI KONCERN NAF ORLEN 0.172332%
BHARTI AIRTEL 0.172121%
KEPCO KOREA ELECT. POWER 0.171472%
LARSEN & TOUBRO 0.171044%
GRUPO TELEVISA CPO 0.170884%
OTP BANK 0.170829%
DELTA ELECTRONICS 0.169961%
COUNTRY GARDEN HLDGS 0.168159%
CHINA UNICOM 0.167015%
PICC PPTY & CASUALTY H 0.166583%
CIELO ON 0.165792%
SIAM COMMERCIAL BANK 0.164951%
ASE 0.164798%
BANCO BRADESCO ON 0.164253%
MEGA FINANCIAL HOLDING 0.164202%
ASPEN PHARMACARE HLDGS 0.162617%
SK HOLDINGS 0.162401%
CHINA SHENHUA ENERGY H 0.161512%
STATE BANK OF INDIA 0.160065%
KASIKORNBANK FGN 0.158080%
REMGRO 0.157221%
CITIC 0.157182%
MAHINDRA & MAHINDRA 0.155703%
BANCO BRASIL ON 0.155196%
SAMSUNG LIFE INSURANCE 0.155195%
AIRPORTS OF THAILAND 0.155104%
BRILLIANCE CHINA AUTO 0.154083%
YES BANK 0.154065%
CHINA RESOURCES LAND 0.154005%
KIA MOTORS CORP 0.153692%
TAL EDUCATION GROUP ADR 0.153278%
SANLAM 0.152498%
BARCLAYS AFRICA GROUP 0.150655%
SUN PHARMACEUTICAL IND 0.149635%
EMIRATES TELECOM CORP 0.148449%
ULTRAPAR PART ON 0.148281%
LG CORP (NEW) 0.147624%
SHOPRITE HOLDINGS 0.145526%
KROTON EDUCACIONAL ON 0.144683%
POWSZECHNY ZAKLAD UBEZP 0.144030%
LOJAS RENNER ON 0.142355%
QATAR NATIONAL BANK 0.141827%
SAMSUNG FIRE & MARINE 0.140066%
NCSOFT CORP 0.138818%
EMAAR PROPERTIES 0.137844%
BID CORPORATION 0.137567%
HCL TECHNOLOGIES 0.137003%
CATCHER TECH CO 0.136984%
HENGAN INTL GROUP CO 0.134452%
CHINA MENGNIU DAIRY CO 0.134369%
SHENZHOU INTERNATIONAL 0.134070%
CHINA TELECOM CORP H 0.129047%
CIMB GROUP HOLDINGS 0.127993%
TELEF BRASIL PN 0.127238%
VEDANTA 0.126374%
58.COM ADR 0.125978%
BANK OF COMMUNICATIONS H 0.124020%
LG DISPLAY CO 0.121955%
ASUSTEK COMPUTER 0.121323%
VODACOM GROUP 0.120537%
RAIA DROGASIL ON 0.118939%
FALABELLA SACI 0.117955%
AYALA LAND 0.117932%
SM PRIME HOLDINGS 0.117729%
SAMSUNG SDS CO 0.117330%
UNITED MICROELECTRONICS 0.117232%
CCR ON 0.116942%
EICHER MOTORS 0.115786%
EMPRESAS COPEC 0.115638%
CHINA TAIPING INSURANCE 0.113390%
FIRST FINANCIAL HLDG CO 0.113191%
SINO BIOPHARMACEUTICAL 0.112096%
GRASIM INDUSTRIES 0.112093%
ANHUI CONCH CEMENT H 0.111938%
BHARAT PETROLEUM CORP 0.111729%
ROSNEFT (RUB) 0.111152%
BB SEGURIDADE PART ON 0.111104%
TAIWAN MOBILE 0.111087%
NEPI ROCKCASTLE 0.111065%
CHINA CITIC BANK H 0.109693%
BDO UNIBANK 0.109671%
E.SUN FINANCIAL HOLDINGS 0.109162%
ULTRATECH CEMENT 0.108988%
ENEL AMERICAS 0.108879%
BYD CO H 0.108071%
INDIABULLS HOUSING FIN 0.108015%
BANK PEKAO 0.107892%
CHINA MINSHENG BANK H 0.107777%
QUANTA COMPUTER 0.106925%
ADVANCED INFO SERVICE 0.106728%
TURKIYE GARANTI BANKASI 0.106554%
UNILEVER INDONESIA 0.106319%
SAMSUNG BIOLOGICS 0.105799%
PTT GLOBAL CHEMICAL 0.104712%
SINA CORP 0.104621%
WIPRO 0.104382%
PRESIDENT CHAIN STORE 0.103956%
WOORI BANK 0.103366%
CHINA GAS HOLDINGS 0.103196%
ENN ENERGY HOLDINGS 0.103119%
FOSUN INTL(CN) 0.102568%
GUANGZHOU AUTO GROUP H 0.102085%
SILLAJEN 0.101434%
SAMSUNG ELECTRO-MECH. CO 0.101037%
BRF ON 0.100910%
SOQUIMICH PREF B 0.099464%
EMART CO 0.097855%
LOTTE CHEMICAL CORP 0.097160%
ASIAN PAINTS 0.096717%
MOBILE TELESYS ADR 0.095594%
AYALA CORP 0.094881%
TIGER BRANDS 0.094793%
AKBANK 0.094415%
NEW CHINA LIFE INS H 0.094328%
GENTING 0.094300%
S-OIL CORP 0.094295%
CHINA COMMUNIC CONST H 0.094262%
SK TELECOM CO 0.094127%
CITIC SECURITIES CO H 0.093889%
WEIBO CORP ADR 0.093174%
COWAY CO 0.092615%
HAITONG SECURITIES CO H 0.092264%
FORMOSA PETROCHEMICAL CO 0.091720%
SINOPHARM GROUP CO H 0.091363%
BIDVEST GROUP 0.091075%
YUANTA FINANCIAL HOLDING 0.090601%
ANTA SPORTS PRODUCTS 0.089328%
FIBRA UNO ADMINISTRACION 0.089249%
NTPC 0.088634%
SM INVESTMENTS 0.088062%
KASIKORNBANK 0.087582%
VTB BANK(RUB) 0.087346%
ZEE ENTERTAINMENT ENT 0.087195%
CHINA HUARONG AST MGMT H 0.087025%
BCO SANTANDER CHILE (NEW 0.086289%
PEGATRON 0.086213%
BANK NEGARA INDONESIA 0.085389%
COMMERCIAL INTL BANK 0.085160%
CHINA VANKE CO H 0.085145%
CHINA RESOURCES BEER 0.084549%
BAJAJ FINANCE 0.083700%
HYUNDAI STEEL CO 0.083686%
KAKAO CORP 0.083487%
SIAM CEMENT FGN 0.083342%
BANCOLOMBIA PREF 0.083250%
ADANI PORTS AND SEZ 0.083104%
TAIWAN COPR FINL HLDG 0.083088%
PETRONAS CHEMICALS GROUP 0.083014%
YY INC ADR 0.082862%
KGHM POLSKA MIEDZ 0.081943%
TAISHIN FINANCIAL HLDG 0.081829%
WOOLWORTHS HOLDINGS 0.081822%
RUMO ON 0.081613%
CHINA DEV FINANCIAL HLDG 0.081538%
HINDALCO INDUSTRIES 0.081396%
DISCOVERY HOLDINGS 0.081054%
TURKCELL ILETISIM HIZMET 0.080606%
HYUNDAI HEAVY INDUSTRIES 0.080339%
BAJAJ AUTO 0.080028%
UNITED TRACTORS 0.079468%
MOL MAGYAR OLAJ GAZIPARI 0.079455%
ANGLOGOLD ASHANTI 0.079382%
GRUPO FIN INBURSA O 0.078975%
LENOVO GROUP 0.077797%
GUANGDONG INVESTMENT 0.077755%
TAIWAN CEMENT CORP 0.077462%
SMIC 0.077310%
UPL 0.076945%
DP WORLD 0.076314%
ABU DHABI COMM BANK 0.076287%
BIM BIRLESIK MAGAZALAR 0.076159%
KANGWON LAND 0.075986%
HUA NAN FINANCIAL HLDGS 0.075902%
WANT WANT CHINA HLDGS 0.075824%
GROWTHPOINT PROP LTD 0.075794%
DR REDDY’S LABORATORIES 0.075742%
AMOREG 0.075666%
SAPPI 0.075395%
PTT EXPLORATION & PROD 0.075125%
WEG ON 0.075098%
EQUATORIAL ENERGIA ON 0.074734%
FIRST ABU DHABI BANK 0.074463%
TITAN COMPANY 0.074176%
BHARTI INFRATEL 0.074069%
HINDUSTAN PETROLEUM CORP 0.074004%
INNOLUX CORP 0.073864%
GRUPO AEROPORTUARIO B 0.073564%
GRUPO BIMBO A 0.073109%
CRRC CORP H 0.073063%
JG SUMMIT HOLDINGS 0.072919%
NEDBANK GROUP 0.072918%
FAR EASTONE TELECOM. CO 0.072800%
LATAM AIRLINES GROUP 0.072655%
PRICE GROUP (MR) 0.072200%
TUPRAS TURKIYE PETROL 0.071890%
BEIJING ENTERPRISE WATER 0.071793%
KOREA ZINC 0.071719%
BK SANTANDER BRASIL UNIT 0.071390%
REDEFINE PROPERTIES LTD 0.071376%
GRUPO AEROP PACIFICO B 0.071113%
CEZ CESKE ENER ZAVODY 0.071010%
GENTING MALAYSIA 0.070638%
HYUNDAI MOTOR CO PREF 2 0.070487%
INDUSTRIES QATAR 0.070468%
SOUTHERN COPPER CORP 0.069503%
GREAT WALL MOTOR H 0.069478%
AU OPTRONICS CORP 0.069224%
GODREJ CONSUMER PRDCTS 0.068976%
CHINA RESOURCES POWER 0.068936%
HANKOOK TIRE CO 0.068922%
HYUNDAI ROBOTICS 0.068864%
RICHTER GEDEON 0.068655%
GAIL INDIA 0.068560%
PEOPLE’S INSURANCE CO H 0.068504%
BANK ZACHODNI WBK 0.068418%
CHINA CONCH VENTURE 0.068367%
OIL & NATURAL GAS CORP 0.068347%
CENCOSUD 0.068315%
KINGBOARD CHEM HLDG (CN) 0.067958%
EMPRESAS CMPC 0.067841%
INDUSTRIAL BANK OF KOREA 0.067840%
DIGI.COM 0.067451%
HYPERMARCAS ON 0.067429%
AXIATA GROUP 0.067253%
INDIAN OIL CORP 0.066999%
MOTHERSON SUMI SYSTEMS 0.066998%
GERDAU PN 0.066850%
WIN SEMICONDUCTORS 0.066695%
LONGFOR PROPERTIES CO 0.066428%
MIRAE ASSET DAEWOO 0.066419%
CHAILEASE HOLDING 0.066156%
RMB HOLDINGS 0.066090%
PAO DE ACUCAR PN 0.065942%
GOLD FIELDS 0.065732%
TECH MAHINDRA 0.065658%
AL RAYAN BANK 0.065498%
SURGUTNEFTEGAZ PREF(RUB) 0.065366%
BANCO DE CHILE 0.065365%
FIBRIA CELULOSE ON 0.065355%
VIPSHOP HOLDINGS ADR 0.065274%
ALROSA (RUB) 0.065256%
ALFA 0.065134%
SABESP ON 0.065028%
COCA-COLA FEMSA L 0.064883%
DONGFENG MOTOR GROUP H 0.064862%
LOJAS AMERICANAS PN 0.064702%
SURGUTNEFTEGAZ COMN(RUB) 0.064637%
SILICONWARE PRECISION 0.064497%
CHINA MERCHANTS PORT 0.064118%
CHINA RESOURCES GAS GRP 0.064003%
HAIER ELCTRNCS GRP (CN) 0.063942%
CENTRAL PATTANA PUB CO 0.063721%
HUATAI SECURITIES CO H 0.063702%
JSW STEEL 0.063216%
CHINA EVERBRIGHT INTL 0.063109%
CHENG SHIN RUBBER IND 0.063039%
PIRAMAL ENTERPRISES 0.062908%
CHINA CINDA ASSET MGMT H 0.062801%
HANMI PHARM CO (NEW) 0.062661%
SINOPAC HOLDINGS 0.062437%
SEVERSTAL (RUB) 0.062399%
KLABIN UNIT 0.061725%
THAI OIL 0.061486%
CIPLA 0.061351%
KOC HOLDING 0.061226%
TINGYI HOLDING CORP (CN) 0.060966%
TATA STEEL 0.060774%
KOMERCNI BANKA 0.060663%
HOTAI MOTOR COMPANY 0.060606%
EMBRAER ON 0.060587%
BR MALLS PARTICIPACOE ON 0.060516%
LOCALIZA RENT A CAR ON 0.060282%
ZHUZHOU CRRC TIMES H 0.060205%
MOSCOW EXCHANGE (RUB) 0.059238%
KOREA AEROSPACE IND 0.058890%
DB INSURANCE CO 0.058863%
TIM PARTICIPACOES ON 0.058698%
GP INV SURAMERICANA 0.058411%
RESILIENT REIT 0.058324%
LPP 0.058259%
SHRIRAM TRANSPORT FIN 0.058053%
BAJAJ FINSERV 0.057729%
OTE HELLENIC TELECOM 0.057536%
EREGLI DEMIR CELIK FABRI 0.057221%
ARCA CONTINENTAL 0.056974%
CHINA RAILWAY GROUP H 0.056927%
INDUSTRIAS PENOLES CP 0.056648%
COMPAL ELECTRONICS 0.056310%
INFRA ENERGETICA 0.055968%
SIME DARBY PLANTATION 0.055741%
ECOPETROL 0.055645%
CGN POWER CO H 0.055539%
GRP FINL SANTANDER B 0.055506%
AUTOHOME ADR 0.055424%
UNITED SPIRITS 0.055342%
BEIJING ENTERPRISES HLDG 0.055159%
MINOR INTERNATIONAL 0.055098%
COAL INDIA 0.055069%
CAPITEC BANK HOLDINGS 0.054906%
NETMARBLE GAMES 0.054752%
KUALA LUMPUR KEPONG 0.054743%
SAMSUNG HEAVY INDUSTRIES 0.054642%
CJ CHEILJEDANG CORP 0.054635%
GS HOLDINGS CORP 0.054582%
FULLSHARE HOLDINGS (CN) 0.054580%
HANWHA CHEMICAL CORP 0.054476%
POLISH OIL & GAS 0.054332%
IHH HEALTHCARE 0.054301%
MAXIS BHD 0.054123%
CELLTRION HEALTHCARE 0.053995%
NINE DRAGONS PAPER 0.053966%
POLSKA GRUPA ENER 0.053922%
HM SAMPOERNA 0.053918%
GLOBALWAFERS 0.053739%
KUNLUN ENERGY 0.053731%
SHIN KONG FINL HLDGS 0.053670%
LUPIN 0.053435%
DABUR INDIA 0.053383%
HERO MOTOCORP 0.053341%
MONDI (ZA) 0.053173%
MACRONIX INTERNATIONAL 0.053047%
ALPHA BANK 0.052944%
NESTLE INDIA 0.052796%
SPAR GROUP (THE) 0.052761%
GF SECURITIES CO H 0.052706%
AUROBINDO PHARMA 0.052554%
GRUMA B 0.052267%
HUANENG POWER INTL H 0.052175%
ENEL GENERACION CHILE 0.052062%
FAR EASTERN NEW CENTURY 0.052051%
CHINA MEDICAL SYSTEM 0.052022%
GUDANG GARAM 0.052021%
KIMBERLY-CLARK MEXICO A 0.051726%
TRUWORTHS INTERNATIONAL 0.051603%
CHINA STATE CONSTRUCTION 0.051500%
PETRONAS GAS 0.051406%
ABOITIZ EQUITY VENTURES 0.051119%
OPAP 0.051057%
NOVOLIPETSK STEEL (RUB) 0.050966%
THE FOSCHINI GROUP 0.050900%
MEXICHEM SAB DE CV 0.050884%
BUENAVENTURA MINAS ADR 0.050784%
POU CHEN CORP 0.050737%
EXXARO RESOURCES 0.050478%
LIC HOUSING FINANCE 0.050406%
LITE-ON TECHNOLOGY CORP 0.050390%
CJ CORP 0.050184%
WINBOND ELECTRONICS CORP 0.050105%
HYOSUNG CORP 0.050052%
CHINA GALAXY SEC H 0.049913%
TRAVELSKY TECHNOLOGY H 0.049750%
CHINA NATL BUILDING H 0.049672%
ALUMINUM CORP OF CHINA H 0.049512%
BANCO DE CREDITO E INVER 0.049271%
FOXCONN TECHNOLOGY CO 0.049122%
IMPERIAL HOLDINGS 0.049009%
CHANG HWA COMMERCIAL BK 0.049003%
ZTE CORP H 0.048476%
HOTEL SHILLA CO 0.048398%
BANGKOK DUSIT MED. SVCS 0.048119%
PLDT 0.048024%
INDOCEMENT TUNGGAL 0.047927%
TURKIYE IS BANKASI C 0.047897%
KALBE FARMA 0.047696%
HYUNDAI ENGR. & CONSTR. 0.047594%
LIFE HEALTHCARE GROUP 0.047522%
HYUNDAI GLOVIS CO 0.047344%
FORTRESS INCOME FUND B 0.047240%
HYUNDAI MARINE & FIRE 0.046744%
MOMO A ADR 0.046552%
AMBUJA CEMENTS 0.046542%
CHINA RESOURCES PHARMA 0.046506%
CHINA LIFE INSURANCE CO 0.046156%
KOREA INVESTMENT HLDG 0.046056%
SUZANO PAPEL E CELU ON 0.046026%
HONG LEONG BANK 0.046021%
ORION CORP (NEW) 0.045911%
IOI CORP 0.045850%
BRASKEM PN A 0.045764%
SABANCI HLDG (HACI OMER) 0.045704%
SUN ART RETAIL GROUP 0.045698%
INDOFOOD SUKSES MAKMUR 0.045447%
SHIMAO PROPERTY HLDGS 0.045313%
SIBANYE GOLD 0.045302%
HANON SYSTEMS 0.045202%
PROMOTORA Y OPER DE INFR 0.045013%
VAKRANGEE 0.044747%
SHANGHAI FOSUN PHARMA H 0.044647%
CHINA RAILWAY CONST H 0.044359%
INDORAMA VENTURES 0.044333%
ADVANTECH CO 0.044250%
UNIVERSAL ROBINA CORP 0.044175%
MISC BHD 0.044129%
HIWIN TECHNOLOGIES CORP 0.044088%
HYUNDAI DEVELOPMENT CO 0.043508%
CHINA MOLYBDENUM CO H 0.043436%
BOSCH 0.043404%
AGILE GROUP HOLDINGS 0.043403%
NOVATEK MICROELECTRS 0.043255%
KINGSOFT 0.043104%
SAMSUNG SECURITIES CO 0.042956%
POLYUS (RUB) 0.042913%
BNK FINANCIAL GROUP 0.042899%
WPG HOLDINGS CO 0.042729%
SHREE CEMENT 0.042627%
BHARAT FORGE 0.042512%
CHAROEN POKPHAND FOODS 0.042394%
IJM CORP 0.041918%
BANCOLOMBIA 0.041826%
BUMRUNGRAD HOSPITAL PUB 0.041749%
ASHOK LEYLAND 0.041661%
BEIJING CPTL INTL AIR H 0.041649%
LOTTE SHOPPING CO 0.041566%
MARICO 0.041562%
YAGEO CORP 0.041491%
CHINA LONGYUAN POWER H 0.041231%
QUALICORP ON 0.041168%
BRITANNIA INDUSTRIES 0.041053%
BERLI JUCKER 0.040894%
GUANGZHOU R&F PROP H 0.040832%
HYUNDAI MOTOR CO PREF 0.040715%
WEICHAI POWER CO H 0.040607%
DAELIM INDUSTRIAL CO 0.040561%
CCC 0.040415%
LG INNOTEK CO 0.040353%
JOLLIBEE FOODS CORP 0.040344%
ASIA CEMENT CORP 0.040307%
ENEL CHILE 0.040089%
KRUNG THAI BANK 0.039932%
VANGUARD INTL SC 0.039896%
IDEA CELLULAR 0.039881%
GCL POLY ENERGY 0.039800%
RAND MERCHANT INV HLDGS 0.039754%
AIRTAC INTERNATIONAL 0.039590%
POWERTECH TECHNOLOGY 0.039519%
SEMEN GRESIK 0.039398%
CHINA EVERBRIGHT 0.039286%
GAMUDA 0.039244%
JBS ON 0.039037%
KCC CORP 0.038975%
DUBAI ISLAMIC BANK 0.038773%
SINOPEC SHANGHAI PETRO H 0.038744%
INTER RAO UES(RUB) 0.038145%
ACER 0.037878%
HAVELLS INDIA 0.037681%
WISTRON CORP 0.037597%
AIR CHINA H 0.037471%
GRUPO ARGOS 0.037460%
FUYAO GLASS IND GRP H 0.037306%
GT CAPITAL HOLDINGS 0.037305%
ZIJIN MINING GROUP H 0.037203%
SINO OCEAN GROUP HOLDING 0.037164%
MATAHARI DEPARTMENT 0.037154%
MBANK 0.037105%
3SBIO 0.037028%
PSG GROUP 0.037014%
SHINSEGAE CO (NEW) 0.036964%
PPB GROUP 0.036927%
INVESTEC LTD (ZA) 0.036570%
M & M FINANCIAL SVCS 0.036439%
IRPC PUBLIC COMPANY 0.036384%
JIANGXI COPPER CO H 0.036364%
HYPROP INVESTMENTS LTD 0.036273%
LEE & MAN PAPER MFG (CN) 0.036170%
ALDAR PROPERTIES 0.036008%
INVENTEC CO 0.035981%
SYNNEX TECHNOLOGY INTL 0.035842%
NEXTEER AUTOMOTIVE GRP 0.035712%
CERVEZAS 0.035633%
HAITIAN INTL HLDGS 0.035541%
OCI COMPANY 0.035397%
ALIOR BANK 0.035330%
MEITU 0.035287%
MEDY-TOX 0.035271%
CD PROJEKT 0.035135%
CEMIG PN 0.035069%
GRUPO CARREFOUR BRASIL 0.035020%
METRO PACIFIC INVESTMENT 0.034984%
DIALOG GROUP 0.034954%
BANGKOK EXPRESSWAY & MET 0.034897%
TECO ELECTRIC & MACH 0.034832%
ADARO ENERGY PT 0.034581%
FAR EAST HORIZON 0.034565%
BGF RETAIL 0.034481%
MULTIPLAN EMPREENDIM ON 0.034475%
YANZHOU COAL MINING H 0.034216%
LG CHEM PREF 0.034161%
COSAN ON 0.034137%
INTERCONEXION ELEC (NEW) 0.034092%
NATIONAL BANK OF GREECE 0.033986%
ENGIE BRASIL ON 0.033816%
NH INVESTMENT & SEC 0.033795%
PICK N PAY STORES 0.033777%
CHONGQING RURAL COMM H 0.033705%
HANSSEM CO 0.033635%
OOREDOO 0.033589%
TURK HAVA YOLLARI 0.033574%
MONETA MONEY BANK 0.033570%
EZDAN HOLDING GROUP 0.033419%
SHANGHAI PHARMA H 0.033399%
TRUE CORP 0.033149%
NANYA TECHNOLOGY 0.033081%
HANWHA LIFE INSURANCE 0.032827%
PHOSAGRO GDR 0.032753%
DAMAC PROPERTIES DUBAI 0.032587%
PETRONET LNG 0.032530%
ZHEJIANG EXPRESSWAY H 0.032492%
NETCARE 0.032485%
CHINA JINMAO HLDGS GROUP 0.032458%
CHINA OILFIELD SVCS H 0.032443%
JIANGSU EXPRESSWAY CO H 0.032416%
MAGNITOGORSK IRON (RUB) 0.032276%
HANWHA CORP 0.032249%
YUHAN CORP 0.032187%
AMMB HOLDINGS 0.032158%
ASELSAN ELEKTRONIK 0.032114%
MALAYSIA AIRPORTS HLDGS 0.031991%
COSCO SHIPPING PORTS 0.031901%
PRESS METAL ALUMINIUM 0.031843%
TELEKOM MALAYSIA 0.031776%
RURAL ELECTRIFICATION CO 0.031465%
CEMENTOS ARGOS (NEW) 0.031436%
BANGKOK BANK FGN 0.031269%
ALIBABA PICTURES GROUP 0.031185%
JUMBO 0.031133%
CHINA STH AIRLINES H 0.031057%
ING LIFE INSURANCE KOREA 0.030993%
REALTEK SEMICONDUCTOR 0.030966%
EUROBANK ERGASIAS 0.030768%
LOTTE HOLDINGS 0.030701%
ALIBABA HEALTH INFO TECH 0.030610%
ECLAT TEXTILE COMPANY 0.030549%
MICRO-STAR INTERNATIONAL 0.030516%
CHAROEN POKPHAND INDO 0.030451%
S1 CORPORATION 0.030088%
BANK OF PHIL ISLANDS 0.029887%
SIAM CEMENT 0.029876%
BYD ELECTRONIC INTL 0.029841%
ENERGY ABSOLUTE 0.029840%
NATURA COSMETICOS ON 0.029776%
COLBUN 0.029749%
CJ E&M CORPORATION 0.029721%
TATA POWER CO 0.029670%
DGB FINANCIAL HOLDINGS 0.029554%
HARTALEGA HOLDINGS 0.029464%
CYFROWY POLSAT SA 0.029379%
HOME PRODUCT CENTER 0.029367%
CHINA COMMU SERVICES H 0.029319%
KUMHO PETRO CHEMICAL CO 0.029239%
HUANENG RENEWABLES H 0.029124%
KUMBA IRON ORE 0.029075%
AGUAS ANDINAS 0.028657%
HTC CORP 0.028627%
GIANT MANUFACTURING CO. 0.028566%
RUSHYDRO (RUB) 0.028534%
PHISON ELECTRONICS CORP 0.028519%
GRUPO CARSO 0.028380%
ELETROBRAS PN B 0.028333%
BTS GROUP HOLDINGS 0.028290%
QATAR ISLAMIC BANK 0.028230%
HAP SENG CONSOLIDATED 0.028133%
PETRONAS DAGANGAN 0.028094%
M DIAS BRANCO ON 0.028036%
COMMERCIAL BANK OF QATAR 0.028005%
GRUPO AVAL ACCIONES PREF 0.027960%
TSINGTAO BREWERY H 0.027905%
STANDARD FOODS CORP 0.027878%
INDOFOOD CBP SUKSES 0.027853%
ENTEL 0.027575%
GP INV SURAMERICANA PREF 0.027441%
FENG TAY ENTERPRISE CO 0.027435%
BANK MILLENNIUM 0.027322%
ANGLO AMERICAN PLATINUM 0.027220%
TRANSNEFT PREF (RUB) 0.027218%
CSN SIDERURGICA NATL ON 0.027211%
NIEN MADE ENTERPRISE CO 0.027103%
LOTOS GROUP 0.027027%
MMI HOLDINGS 0.026784%
TURKIYE HALK BANKASI 0.026762%
NESTLE (MALAYSIA) 0.026663%
AMOREPAC CORP PREF (NEW) 0.026607%
QATAR INSURANCE CO 0.026465%
SHANGHAI INDL HOLDINGS 0.026339%
CHICONY ELECTRONICS CO 0.026328%
PERUSAHAAN GAS NEGARA 0.026208%
LG HOUSEHOLD & HEAL PREF 0.026158%
SIME DARBY 0.026146%
MANILA ELECTRIC CO B 0.026131%
SHANGHAI LUJIAZUI B(USD) 0.025985%
TATA MOTORS A 0.025874%
CADILA HEALTHCARE 0.025845%
JASTRZEBSKA SPOLKA WEGL 0.025777%
GLOW ENERGY 0.025732%
KOREAN AIR CO 0.025659%
FORTRESS REIT 0.025478%
TAIWAN HIGH SPEED RAIL 0.025429%
HANMI SCIENCE CO 0.025424%
HYUNDAI DEPT STORE 0.025078%
GENERAL INTERFACE SOLN 0.025020%
BRITISH AMER TOBACCO MY 0.024944%
CHEIL WORLDWIDE 0.024898%
EDP ENERGIAS DO BRASI ON 0.024863%
DELTA ELECTRONICS THAI 0.024857%
SIHUAN PHARMA HLDGS 0.024846%
SHANDONG WEIGAO GROUP H 0.024800%
SIEMENS INDIA 0.024769%
ALLIANCE GLOBAL GROUP 0.024543%
CHINA EVERBRIGHT BANK H 0.024406%
PORTO SEGURO ON 0.024265%
ODONTOPREV ON 0.024182%
GOME RETAIL HOLDINGS 0.024115%
BRAIT SA 0.023930%
GS ENGINEERING & CONSTR 0.023925%
ELETROBRAS ON 0.023910%
YTL CORP 0.023867%
PUERTO DE LIVERPOOL C1 0.023825%
BANK DANAMON INDONESIA 0.023823%
BHARAT HEAVY ELECTRICALS 0.023797%
ANADOLU EFES BIRACILIK 0.023596%
QATAR ELECT & WATER CO 0.023389%
ARCELIK 0.023338%
PIONEER FOODS 0.023335%
ITAU CORPBANCA 0.023059%
SOHO CHINA 0.022954%
SAPURA ENERGY 0.022757%
TRANSMISSORA ALIANC UNIT 0.022754%
GLENMARK PHARMACEUTICALS 0.022742%
CORONATION FUND MANAGERS 0.022732%
GLOBE TELECOM 0.022652%
EMLAK KONUT GAYRIMENKUL 0.022465%
METROPOLITAN BANK &TRUST 0.022428%
ACC 0.022401%
POWER FINANCE CORP 0.022372%
TMB BANK 0.022354%
MEGAWORLD CORP 0.022229%
PLAY COMMUNICATIONS 0.022166%
AIRASIA BHD 0.022073%
HANWHA TECHWIN CO 0.022060%
IDFC BANK 0.022025%
DMCI HOLDINGS 0.021923%
EMBOTELLADORA PREF B 0.021862%
EMAAR MALLS 0.021842%
SUL AMERICA UNITS 0.021787%
ROBINSON PCL 0.021530%
PETKIM PETROKIMYA HLDG 0.021513%
ABOITIZ POWER 0.021507%
TITAN CEMENT CO 0.021501%
PANOCEAN 0.021443%
CJ KOREA EXPRESS CORP 0.021425%
DOOSAN BOBCAT 0.021331%
AVICHINA IND & TECH H 0.021278%
SHANGHAI ELECTRIC GRP H 0.021218%
SECURITY BANK CORP 0.021194%
KOREA GAS CORPORATION 0.021124%
EVERGREEN MARINE CORP 0.021052%
LIBERTY HOLDINGS 0.020833%
ASTRO MALAYSIA HOLDINGS 0.020747%
BANPU 0.020693%
HIGHWEALTH CONSTRUCTION 0.020620%
DOHA BANK 0.020505%
THAI UNION GROUP 0.020472%
ICTSI INTL CONTAINER 0.020456%
EVA AIRWAYS CORP 0.020398%
TURKIYE VAKIFLAR BANKASI 0.020363%
TAIMED BIOLOGICS 0.020242%
CHINA AIRLINES 0.020067%
ZHEN DING TECHNOLOGY 0.019871%
QATAR GAS TRAN (NAKILAT) 0.019738%
JASA MARGA (PERSERO) 0.019616%
TAIWAN BUSINESS BANK 0.019520%
SP SETIA 0.019325%
SAMSUNG CARD CO 0.019316%
GS RETAIL 0.019300%
BANK TABUNGAN NEGARA 0.019157%
DINO POLSKA 0.019132%
DUBAI INVESTMENT 0.019052%
HYUNDAI WIA CORP 0.019036%
FORD OTOMOTIV SANAYI 0.019021%
PAKUWON JATI 0.018989%
TOFAS TURK OTOMOBIL FAB. 0.018830%
ORANGE POLSKA 0.018796%
RHB BANK 0.018369%
OIL & GAS DEVELOPMENT 0.018197%
SURYA CITRA MEDIA 0.018184%
DONGSUH COMPANIES 0.017990%
RUENTEX DEVELOPMENT CO 0.017979%
BUMI SERPONG DAMAI 0.017952%
TELKOM SA SOC 0.017836%
TAURON POLSKA ENERGIA 0.017812%
GRUPO LALA B 0.017728%
RUENTEX INDUSTRIES 0.017662%
ALLIANCE BANK MALAYSIA 0.017356%
HABIB BANK 0.017349%
GRUPA AZOTY 0.017338%
GLOBAL TELECOM HOLDING 0.017248%
HONG LEONG FINANCIAL GRP 0.017228%
YAPI VE KREDI BANKASI 0.017175%
GENTERA 0.017045%
OTTOGI CORPORATION 0.016758%
KT CORP 0.016733%
AES GENER 0.016669%
ELECTRICITY GENERATING 0.016585%
WESTPORTS HOLDINGS 0.016449%
TOWER BERSAMA INFRA 0.016426%
PIRAEUS BANK 0.016288%
AKR CORPORINDO 0.016154%
TURKIYE SISE VE CAM FABR 0.015902%
TAV HAVALIMANLARI HLDG 0.015869%
CONTAINER CORP OF INDIA 0.015694%
UNITED BANK 0.015592%
MCB BANK 0.015372%
SK NETWORKS 0.015180%
DOOSAN HEAVY INDUSTRIES 0.014986%
KEPCO PLANT SVCS & ENGR 0.014847%
O2 CZECH REPUBLIC 0.014785%
TURK TELEKOMUNIKASYON 0.014714%
IOI PROPERTIES GROUP 0.014644%
FORMOSA TAFFETA CO 0.014555%
BARWA REAL ESTATE CO 0.014299%
WASKITA KARYA PERSERO 0.014167%
XL AXIATA TBK 0.013957%
ULKER BISKUVI SANAYI 0.013719%
ROBINSONS LAND CORP 0.013643%
SYNTHOS 0.013591%
SIME DARBY PROPERTY 0.013351%
ASIA PACIFIC TELECOM CO 0.013084%
BK HANDLOWY W WARSZAWIE 0.013075%
COCA-COLA ICECEK 0.013070%
EFG-HERMES HOLDING 0.012922%
KCE ELECTRONICS 0.012759%
FF GROUP 0.012642%
FELDA GLOBAL VENTURES 0.012414%
DAEWOO ENGR & CONSTR 0.012111%
GENTING PLANTATIONS 0.011828%
POSCO DAEWOO 0.011821%
LUCKY CEMENT 0.011607%
UMW HOLDINGS 0.011512%
DXB ENTERTAINMENTS 0.010991%
YTL POWER INTL 0.010943%
The Martin Currie Global Portfolio Trust is a London listed investment trust.
https://www.martincurrie.com/uk/global-portfolio-trust
It’s top 10 holdings which make up 36.6% of total portfolio are:-
Visa 4.5%
Apple 4.3%
JP Morgan Chase 4.1%
AIA 4.1%
Lockheed Martin 3.2%
Prudential 3.2%
Airbus 3.0%
Check Point 2.9%
Cognizant 2.8%
CSL 2.8%
Number of holdings 48, Number of countries 16.
http://www.shareshop.hsbc.co.uk/shareshop/security.cgi?csi=12840
The City of London Investment Trust is a highly regarded investment trust, listed on the London Stock Exchange
https://www.janushenderson.com/ukpi/fund/169/the-city-of-london-investment-trust-plc
Managed by Janus Henderson
It actually trades at a Premium, so the assets are worth about £4.00 and the shares trade at £4.22.
It’s top 10 holdings are:-
Royal Dutch Shell 5.9% of the fund
HSBC 4.4% of the fund
British American Tobacco 4.2% of the fund
BP 3.3% of the fund
Diageo 3.1% of the fund
Lloyds Banking Group 2.8% of the fund
Prudential 2.7% of the fund
Unilever 2.7% of the fund
RELX 2.6% of the fund
Vodafone 2.5% of the fund
The BlackRock North American Income Trust aims to provide an attractive and growing level of income return with capital appreciation over the long term, predominantly through investment in a diversified portfolio of primarily large-cap US equities
Its top ten holdings are:-
JPMorgan Chase USA 4.3% of the fund
Bank of America USA 4.3% of the fund
Pfizer USA 3.7% of the fund
Citigroup USA 3.5% of the fund
Wells Fargo USA 2.9% of the fund
Oracle USA 2.9% of the fund
Microsoft USA 2.5% of the fund
Anthem USA 2.4% of the fund
Verizon Communications USA 2.4% of the fund
Royal Dutch Shell Netherlands 2.3% of the fund
http://www.shareshop.hsbc.co.uk/shareshop/security.cgi?csi=2895465&action=
a yield of 3%
The Legal & General Future World Equity Factors Index Fund is a new index fund from Legal and General, the investment objective of the Fund is to seek to provide both capital growth and income by tracking the performance of the FTSE All-World ex CW Climate Balanced Factor Index
It spreads its risks across these sectors:-
Industrials 18.3% of the fund
Consumer Services 16.2% of the fund
Consumer Goods 14.1% of the fund
Financials 14.1% of the fund
Health Care 9.5% of the fund
Technology 9.4% of the fund
Utilities 6.6% of the fund
Basic Materials 5.0% of the fund
Telecommunications 4.1% of the fund
Oil & Gas 2.8% of the fund
The Foreign & Colonial Property Trust PLC pays out its dividend on a monthly basis.
It is 0.5p a share, a month.
The company had 799,366,108 Ordinary Shares in issue. The number of shares with voting rights was 799,366,108, each carrying one voting right.
Thus we can calculate the cost of the monthly dividend:
799,366,108 x £0.005 = £3,996,830.54 a month
Which equate to £47,961,966.48 a year.
http://www.shareshop.hsbc.co.uk/shareshop/security.cgi?csi=112535
4% yield.
“If you are shopping for common stocks, choose them the way you would buy groceries, not the way you would buy perfume.”

On Thur 12th April, the UK’s premier health and pharma company, Glaxo Smithkline paid its half yearly dividend.
12p per share.
the total number of voting rights in the Company is 4,958,962,323
Thus:
23p x 4,958,962,323 = £1,140,561,334.29
That is £1.14 Billion
http://www.shareshop.hsbc.co.uk/shareshop/security.cgi?csi=10042
5.5% yield.
The Multi Index 3 Fund from Legal and General.
It holds:-
Legal & General All Stocks Gilt Index Trust ‘I’ Inc 11.04%
Legal & General Sterling Corporate Bond Index Fund ‘L’ Inc 10.80%
Legal & General Global Inflation Linked Bond Index Fund ‘L’ Inc 10.53%
Legal & General Short Dated Sterling Corporate Bond Index Fund ‘L’ Inc 8.23%
LGIM Global Corporate Bond Fund ‘B’ Acc 8.02%
Legal & General Emerging Markets Government Bond (US$) Index Fund ‘L’ Inc 5.85%
Legal & General UK Property Fund ‘L’ Inc 4.84%
Legal & General US Index Trust ‘I’ Inc 4.68%
Legal & General High Income Trust ‘I’ Inc 4.40%
Legal & General UK Index Trust ‘L’ Inc 3.70%
The middle east accounts for 34.5% (over one third) of global oil production according to BP’s Energy Statistical review.
That does this mean ?
Iran 5.0%
Iraq 4.8%
Kuwait 3.4%
Oman 1.1%
Qatar 2.1%
Saudi Arabia 13.4%
Syria no figure
United 4.4%
Yemen no figure
Other Middle East 0.2%
Total = 34.5%
This 34.5% is 31,789,000 barrels of oil a day.
the value is that oil is worth about $70 a barrel, thus:-
31,789,000 barrels of oil a day x $70 = $2,225,230,000.00
That is $2.225 Billion a day.
The rules on dividends from HMRC are clear to UK tax payers.
You are allowed “only” the first £2,000 of dividends to be tax free, and then anything above is taxed. Dividend income in excess of the allowance is taxable at the following rates: 7.5% within the basic rate band; 32.5% within the higher rate band; and 38.1% on dividend income taxable at the additional rate
So what is £2,000 tax free dividends worth if you held some high quality UK stocks.
e.g the world’s leading Telecommunications corporation is BT plc. www.bt.com
https://www.btplc.com/Sharesandperformance/Dividends/Dividends.htm
In the tax year 2017-18 BT paid 2 dividends:
4.85p in 5th Feb 2018
10.55p in 4th Sept 2017
4.85p + 10.55p = 15.4p
So to have £2,000 dividend income in 2017-18 from BT you would need: £2,000 / £0.154 = 12987.01298701299 Shares in BT plc.
at today’s market price of £2.35
http://www.shareshop.hsbc.co.uk/shareshop/security.cgi?csi=10025&action=
That would mean an investment of £2.35 * 12987.01298701299 = £30519.48051948052
Thus £30,519 buying BT shares today would give an approximate income of £2,000 if all things being equal (share price steady, dividend payment steady). BT Be There.
If you wanted £2,000 income in an oil company like Royal Dutch Shell plc, what would that be ?
Shell pays out 4 dividends a year
https://www.shell.com/investors/dividend-information/historical-dividend-payments.html
It is has remained steady at US$0.47 a share which is about 33p a share.
Thus 4 dividends:-
33p+33p+33p+33p = £1.32
So to have £2,000 dividend income in 2017-18 from Royal Dutch Shell B shares you would need: £2,000 / £1.32 = 1515.151515151515 Shares in Royal Dutch Shell B plc.
at today’s market price of £23.71
http://www.shareshop.hsbc.co.uk/shareshop/security.cgi?csi=133755
That would mean an investment of £23.71 * 1515.151515151515 = £35924.24242424242
Thus £35,924 buying shares in Royal Dutch Shell B would give today would give an approximate income of £2,000 if all things being equal (share price steady, dividend payment steady)
Another month, guess what, take a lucky guess, it is the same old story, HM Government, spends more money than it receives via taxes and duties. Another deficit month, thus to bridge the gap, needs to borrow on the bond market.
In March 2018 , the HM Government had to borrow money to meet the difference between tax revenues and public sector expenditure. The term for this is The PSNCR: The Public Sector Net Cash Requirement.
There were “only” 4 auctions of Gilts (UK Government Bonds) by the UK Debt Management Office (http://www.dmo.gov.uk/) to raise cash for HM Treasury:-
27-Mar-2018 0 1/8% Index-Linked Treasury Gilt 2056 3 months 675.2400 Million
15-Mar-2018 1 5/8% Treasury Gilt 2028 2,864.7310 Million
06-Mar-2018 1½% Treasury Gilt 2047 2,250.0000 Million
01-Mar-2018 0¾% Treasury Gilt 2023 2,815.6600 Million
When you add the cash raised:-
∑(675.2400 Million + 2,864.7310 Million + 2,250.0000 Million + 2,815.6600 Million) = £8605.631 Million
£8605.631 Million = £8.605631 Billion
On another way of looking at it, is in the 31 days in March, HM Government borrowed:-
£277 million each day for the 31 days.
We are fortunate, while the global banking and financial markets still has the confidence in HM Government to buy the Gilts (Lend money to the UK), the budget deficit keeps rising. What is also alarming, is the dates these bond mature 2023, 2028, 2047 and 2056. All long term borrowings, we are mortgaging our futures, but at least “We Are In It Together….”
The Alliance Trust is a famous old UK Investment trust.
https://www.alliancetrust.co.uk/
£2.3 Billion London Listed Investment Fund
Top 20 holdings are:-
Alphabet
Microsoft
Amazon
Comcast
Charter
Communications
Baidu – ADR
United Health
Group
Oracle
Western Union
Page Group
Ryanair
Tencent
AIA
Airbus
Anthem
Novo-Nordisk
HDFC Bank
Visa
Liberty
Interactive
HCA Healthcare
Top 20 holdings make up 24.6% of the trust.
Yesterday, the world’s second largest mininig company, Rio Tinto paid out its dividend.
The dividend was 129.43p a share.
The total number of voting rights in Rio Tinto plc is 1,329,626,900
http://otp.investis.com/clients/uk/rio_tinto1/rns/regulatory-story.aspx?cid=507&newsid=995555
Thus:-
1,329,626,900 x 129.43p a share = £1,720,936,096.67
That is £1.720 Billion paid out by Rio Tinto to its shareholders.
A 5% yield. Delicious.
Yesterday BP plc, one of the oil majors broke the £100bn market value.
BP is a major UK company, in the same premier league as BT, the world’s leading telecommunications corporation, (www.bt.com)
The share price yesterday of BP was £5.011 a share.
The share capital of BP is 19,958,001,728 shares
https://otp.investis.com/clients/uk/bp_plc/rns/regulatory-story.aspx?cid=233&newsid=995631
Thus:
19,958,001,728 shares x £5.011 a share = £100,009,546,659.01
That is £100bn.
You have to stay in school. You have to. You have to go to college. You have to get your degree. Because that’s the one thing people can’t take away from you is your education. And it is worth the investment.
Yesterday, HSBC Holdings PLC paid out is quarterly dividend, of $0.21 (14.762p) a share.
The total number of voting rights in HSBC Holdings plc is 20,053,152,822
Thus:-
20,053,152,822 x 14.762p = £2,960,246,419.58
That is £2,960 Million = £2.960 Billion
A 5.4% yield.
The Dunedin Income Growth Investment Trust plc is 145 years old.
A £370m London Listed investment trust.
http://www.dunedinincomegrowth.co.uk/
Twenty largest equity holdings %
Royal Dutch Shell ‘B’ 4.8% of the fund
British American Tobacco 4.6% of the fund
Prudential 4.4% of the fund
Unilever 4.1% of the fund
HSBC 4.0% of the fund
GlaxoSmithKline 3.9% of the fund
AstraZeneca 3.8% of the fund
BHP Billiton 3.3% of the fund
Vodafone 3.1% of the fund
Total 3.0% of the fund
Assura 3.0% of the fund
Chesnara 2.4% of the fund
Compass 2.3% of the fund
Sage 2.3% of the fund
Standard Chartered 2.2% of the fund
Croda 2.2% of the fund
BP 2.0% of the fund
Novo-Nordisk 1.9% of the fund
Unibail-Rodamco 1.9% of the fund
Close Brothers 1.9% of the fund
Total 61.1% are the 20 top equity holdings above.
Ten largest fixed income holdings %
HBOS Cap Funding 6.461% 9.2% of the fund
SSE 3.875% 7.7% of the fund
BHP Billiton Finance 6.5% 22/10/77 6.2% of the fund
Citigroup 5.125% 12/12/18 5.9% of the fund
Rabobank Cap Funding Trust 5.556% 5.7% of the fund
Firstgroup 6.125% 18/01/19 5.6% of the fund
Barclays Bank 8.25% 29/12/49 4.4% of the fund
Daimler Intl Finance 3.5% 06/06/19 4.4% of the fund
Heathrow Funding 6% 20/03/20 4.3% of the fund
ASIF III Jersey 5% 18/12/18 4.0% of the fund
http://www.shareshop.hsbc.co.uk/shareshop/security.cgi?username=&ac=&csi=10166&record_search=1&search_phrase=dunedin
On Thursday last week (Thur 29th March 2018) BP plc paid out its quarterly dividend.
One of the largest oil companies in the world.
The dividend was 7.1691p per share.
The total number of voting rights in BP p.l.c. is 19,926,859,767
https://otp.investis.com/clients/uk/bp_plc/rns/regulatory-story.aspx?cid=233&newsid=983623
Thus:
19,926,859,767 x £0.071691 = £1,428,576,503.56
That is £1.428 billion.
That is a 6% yield. Delicious
Statoil, Norway’s state oil company has become Equinor.
The move from fossil fuels to an energy company
On Monday 26th March, Royal Dutch Shell paid its quarterly dividend to its shareholders:
www.shell.com
it was:- 33.91p a share:-
| RDSA | Royal Dutch Shell A | FTSE 100 | $0.47 (33.91p) | 26-Mar |
| RDSB | Royal Dutch Shell B | FTSE 100 | $0.47 (33.91p) | 26-Mar |
http://www.shareshop.hsbc.co.uk/shareshop/security.cgi?csi=133655
Shell A
http://www.shareshop.hsbc.co.uk/shareshop/security.cgi?csi=133755
Shell B
Now, 33.91p to shareholders has cost Shell:-
Royal Dutch Shell plc’s capital consists of 4,597,136,050 A shares and 3,745,486,731 B shares, each with equal voting rights. Royal Dutch Shell plc holds no ordinary shares in Treasury.
The total number of A shares and B shares in issue is 8,342,622,781
https://irssl.euroinvestor.com/asp/ir/IRM_Shell/ssl2017/NewsRead.aspx?storyid=13830315&ishtml=1
8,342,622,781 x £0.3391 = £2,828,983,385.04
That is £2.828 Billion. Delicious.
| £2,828,983,385.04 |
| Shares | Company | Percentage of Company Owned | Cost $m | Market Price $m |
| 151,610,700 | American Express | 17.60% | $1,287 | $15,056 |
| 166,713,209 | Apple | 3.30% | $20,961 | $28,213 |
| 700,000,000 | bYD Company | 6.80% | $5,007 | $20,664 |
| 53,307,534 | The Bank of New York Mellon | 5.30% | $2,230 | $2,871 |
| 225,000,000 | BYD Company | 8.20% | $2 232 | $1,961 |
| 6,789,054 | Charter Communications | 2.80% | $1,210 | $2,281 |
| 400,000,000 | The Coca-Cola | 9.40% | $1,299 | $18,352 |
| 53,110,395 | Delta Airlines | 7.40% | $2,219 | $2,974 |
| 44,527,147 | General Motors | 3.20% | $1,343 | $1,825 |
| 11,390,582 | The Goldman Sachs Group | 3.00% | $0 654 | $2,902 |
| 24,669,778 | Moody’s | 12.90% | $9 248 | $3,642 |
| 74,587,892 | Philips 66 | 14.90% | $5,841 | $7,545 |
| 47,659,456 | Southwest Airlines | 8.10% | $1,997 | $3,119 |
| 103,855,045 | US Bancorp | 6.30% | $3,343 | $5,565 |
| 482,544,468 | Wells Fargo | 9.90% | $11,837 | $29,276 |
| Total | $ 74,676 | $ 170,540 |
https://www.youtube.com/watch?v=3zcKLJ8dzgU
ISA Selection, a broad and diverse range of funds are from Legal & General PLC
https://www.legalandgeneral.com/investments/products-and-funds/
Multi-Index 3
Multi-Index 4
Multi-Index 6
Global Technology Index
http://i.legalandgeneral.com/consumer/investments/products-and-funds/index-tracker/investments-productsandfunds-indextracker-fund-globaltech.jsp
Global 100 Index Trust
http://i.legalandgeneral.com/consumer/investments/products-and-funds/index-tracker/investments-productsandfunds-indextracker-fund-global100.jsp L&G Asian Income Trust
http://i.legalandgeneral.com/consumer/investments/products-and-funds/actively-managed/equity/investments-productsandfunds-activelymanaged-equity-fund-asianincome.jsp
L&G Worldwide Trust
Emerging Markets Index Fund
High Income Trust
Distribution Trust
The JPMorgan Russian Securities Investment Trust is a £275m London Listed Investment Trust.
Top 10 Holdings:-
Sberbank of Russia Financials 18.3% of the fund
Gazprom ADR Energy 14.7% of the fund
Lukoil ADR Energy 8.8% of the fund
Rosneft GDR Energy 6.1% of the fund
Novatek GDR Energy 6.0% of the fund
Norilsk Nickel ADR Materials 5.3%% of the fund
Tatneft including ADR Energy 4.9% of the fund
ALROSA Materials 2.7% of the fund
Polyus GDR Materials 2.2% of the fund
Novolipetsk Iron & Steel GDS Materials 2.1% of the fund
http://www.shareshop.hsbc.co.uk/shareshop/security.cgi?csi=52883
3.9% yield.
http://www.berkshirehathaway.com/letters/2017ltr.pdf
The investment company of Warren Buffett
“
To the Shareholders of Berkshire Hathaway Inc.:
Berkshire’s gain in net worth during 2017 was $65.3 billion, which increased the per-share book value of
both our Class A and Class B stock by 23%. Over the last 53 years (that is, since present management took over), pershare
book value has grown from $19 to $211,750, a rate of 19.1% compounded annually.*
The format of that opening paragraph has been standard for 30 years. But 2017 was far from standard: A
large portion of our gain did not come from anything we accomplished at Berkshire.
The $65 billion gain is nonetheless real – rest assured of that. But only $36 billion came from Berkshire’s
operations. The remaining $29 billion was delivered to us in December when Congress rewrote the U.S. Tax Code.
(Details of Berkshire’s tax-related gain appear on page K-32 and pages K-89 – K-90.)
”
The internet retailing giant.
https://www.nasdaq.com/symbol/amzn
Its market capitalisation is now over $650bn dollars.
https://www.youtube.com/watch?v=0rMG5Ve1Ylc
How many millionaires do you know who have become wealthy by investing in savings accounts…. (A quote from Robert Allen)
The reality is that cash and bank deposits are low risk and fine for near term spending requirements and emergency funds but they won’t build wealth over long periods of time.. Despite periodic setbacks (1929 Crash, 1987 Crash, 2008 Global Financial Crisis), shares and other growth assets provide much higher returns over the long term than cash and bank deposits.
AEW UK Long Lease REIT aims to offer investors a secure, diversified and inflation-linked income return, whilst at least maintaining capital values in real terms, through exposure to alternative and specialist real estate sectors in the UK.
It currently holds 11 real estate assets:-
http://www.aewukllreit.com/properties/property-portfolio/all-properties
http://www.shareshop.hsbc.co.uk/shareshop/security.cgi?csi=54582471&action=
Another month, guess what, take a lucky guess, it is the same old story, HM Government, spends more money than it receives via taxes and duties. Another deficit month, thus to bridge the gap, needs to borrow on the bond market.
In Feb 2018 , the HM Government had to borrow money to meet the difference between tax revenues and public sector expenditure. The term for this is The PSNCR: The Public Sector Net Cash Requirement.
There were “only” 2 auctions of Gilts (UK Government Bonds) by the UK Debt Management Office (http://www.dmo.gov.uk/) to raise cash for HM Treasury:-
22-Feb-2018 0 1/8% Index-linked Treasury Gilt 2036 3 months £950.0000 Million
15-Feb-2018 1¾% Treasury Gilt 2057 £2,562.6800 Million
∑(£950.0000 Million + £2,562.6800 Million) = £3512.68 Million
Million
£3512.68 Million = £3.51268 Billion
On another way of looking at it, is in the 28 days in Feb, HM Government borrowed:-
£125 million each day for the 28 days.
We are fortunate, while the global banking and financial markets still has the confidence in HM Government to buy the Gilts (Lend money to the UK), the budget deficit keeps rising. What is also alarming, is the dates these bond mature 2036 and 2057. All long term borrowings, we are mortgaging our futures, but at least “We Are In It Together….”
On Friday 2nd Feb this month, Vodafone PLC paid out is Feb Dividend.
It was €0.0484 a share which equates to £0.0423 a share.
The total number of voting rights in Vodafone is 26,674,714,037
Thus:
26,674,714,037 x £0.0423 = £1,128,340,403.77
The dividend paid out by Vodafone cost £1.128 Billion
http://www.shareshop.hsbc.co.uk/shareshop/security.cgi?csi=10097
Oer 6% yield
6mins and 22 seconds. True Words of Investment Potential
Today, UK Greencoat UK Wind paid the Feb dividend.
http://www.greencoat-ukwind.com/
It has paid out 1.6225p per share.
The total voting rights are 1,028,514,652
http://otp.investis.com/clients/uk/greencoat/rns/regulatory-story.aspx?cid=2184&newsid=945357
What was the cost of the dividend ?
1,028,514,652 x 1.6225p = £16,687,650.23
That is £16.6m
http://www.shareshop.hsbc.co.uk/shareshop/security.cgi?csi=7013076&action=
5.3% Yield
Verizon Communications.
Formed from the merger of Nynex and Bell Atlantic, It also owns Verizon Wireless which itself was formed from the mergers of Vodafone-Airtouch’s US Operations with Verizon Wireless US Operations and GTE.
https://www.nasdaq.com/symbol/vz
The market capitalisation is now $200bn

Exxon Mobil is one of the largest energy companies
It trades under the ticker symbol XOM
The market capitalisation (value) of Exxon Mobil is about $350 Billion
https://ycharts.com/companies/XOM/market_cap
It is still Smaller than Amazon.com
The UK pays out per year £46bn a year on Debt Interest.
That is a huge amount of money, interest on our National Debt. Money paid to our creditors, that is more than the UK Defence Budget
https://www.youtube.com/watch?v=Jft-Mnm7OD8
Another month, guess what, take a lucky guess, it is the same old story, HM Government, spends more money than it receives via taxes and duties. Another deficit month, thus to bridge the gap, needs to borrow on the bond market.
In January 2018 , the HM Government had to borrow money to meet the difference between tax revenues and public sector expenditure. The term for this is The PSNCR: The Public Sector Net Cash Requirement.
There were “only” 4 auctions of Gilts (UK Government Bonds) by the UK Debt Management Office (http://www.dmo.gov.uk/) to raise cash for HM Treasury:-
23-Jan-2018 0 1/8% Index-linked Treasury Gilt 2026 3 months £1,000.0000 Million
18-Jan-2018 0¾% Treasury Gilt 2023 £2,500.0000 Million
11-Jan-2018 1¾% Treasury Gilt 2037 £2,250.0000 Million
09-Jan-2018 1¼% Treasury Gilt 2027 £2,587.4970 Million
When you add the cash raised:-
∑(£1,000.0000 Million + £2,500.0000 Million + £2,250.0000 Million + £2,587.4970 Million ) = £8337.497 Million
£8337.497 Million = £8337.497 Billion
On another way of looking at it, is in the 31 days in January, HM Government borrowed:-
£268.9 million each day for the 31 days.
We are fortunate, while the global banking and financial markets still has the confidence in HM Government to buy the Gilts (Lend money to the UK), the budget deficit keeps rising. What is also alarming, is the dates these bond mature 2023, 2026, 2027 and 2037. All long term borrowings, we are mortgaging our futures, but at least “We Are In It Together….”
Apple is a huge company.
It’s value in terms in Market Capitalisation is huge:-
https://ycharts.com/companies/AAPL/market_cap
$872 Billion.
A great quote:
http://www.bbc.co.uk/news/business-42110539
Following the “Melling Scam” that has caught poor Christine out and how the people of Ambridge got scammed, what’s the deal with Melling Equestrian Investments?
It was run by a very charming friend-of-a-relative-of-a-friend of Justin Elliott. He was smooth and dapper and was offering very high returns of about 12% for investments into what he described as a world class racecourse for top quality horses in Costa Rica
http://www.bbc.co.uk/blogs/thearchers/entries/efe1f330-89af-44d6-b8fb-fef46eac5cf6
12% return in a climate on 0.5% interest rates…..when something looks TOO GOOD TO BE TRUE, IT USUALLY IS !!!!
Today the Foreign & Colonial Investment Trust paid out its Feb 2018 dividend of 2.7p a share.
The total number of voting rights that can be exercised in the Company is 542,180,712
http://www.londonstockexchange.com/exchange/news/market-news/market-news-detail/FRCL/13482101.html
Thus:
542,180,712 x £0.027 = £14,638,879.22
That is £14.638 Million
http://www.shareshop.hsbc.co.uk/shareshop/security.cgi?csi=10192&action=
1.5% yield.
UK Mortgages PLC pays out today its Jan 2018 (Quarterly) dividend of 1.5p a share.
http://www.londonstockexchange.com/exchange/news/market-news/market-news-detail/UKML/13493790.html
250m shars in issue
https://twentyfouram.com/funds/uk-mortgages-fund/
Thus
250,000,000 x £0.015 = £3,750,000
£3.75m paid today to shareholders.
http://www.shareshop.hsbc.co.uk/shareshop/security.cgi?csi=41993839&action=
6% yield.
This is a great sector:-
http://www.bbc.co.uk/news/business-42131742
The news of Biotech and Pharma jobs can only a good thing, the UK is a world leader with names like Astra Zeneca, GlaxoSmithKline.
One can see huge investment opportunities here.
Look at this fund:-
The Legal and General Heath and Pharmaceuticals Index Tracker.
The growth in amazing.
The investments:-
Johnson & Johnson Pharmaceuticals & Biotechnology 7.73% of the fund
Pfizer Pharmaceuticals & Biotechnology 4.65%% of the fund
Novartis AG Pharmaceuticals & Biotechnology 4.45%% of the fund
UnitedHealth Group Health Care Equipment & Services 4.14%% of the fund
Roche Holding AG Part. Cert. Pharmaceuticals & Biotechnology 3.98%% of the fund
Merck & Co. Pharmaceuticals & Biotechnology 3.86%% of the fund
AbbVie Inc Pharmaceuticals & Biotechnology 3.13%% of the fund
Amgen Pharmaceuticals & Biotechnology 3.02%% of the fund
Celgene Corp. Pharmaceuticals & Biotechnology 2.49%% of the fund
Sanofi Pharmaceuticals & Biotechnology 2.38%% of the fund
Top ten investments make up 39.83% of the fund.
We saw last week that the US Federal Government shut down due to both political parties failing to agree on the Federal Budget.
The USA spends more money than it earns from taxes.
The debt today:
$20.6 Trillion.
That equates to $63,000 dollars per US Citizen.
The UK’s worth grew by the largest amount on record to reach £9.8tn at the end of last year, boosted by land value, which has grown “more than fivefold” since 1995, according to the office of national statistics.
Combining the UK’s total assets, the Office for National Statistics (ONS) found that the UK’s value increased by 8.9pc or £803bn between 2015 and 2016. The country’s net worth has risen steadily since 2012, following a course in line with pre-financial crisis conditions. Land was found to be the UK’s single most valuable asset, making up more than half of the UK’s total net worth, according to the annual ONS report, an estimate of the market value of UK assets is known as the national balance sheet.
Non-financial assets increased by £477bn in 2016, with £280bn of that growth coming from rising land value. Land is worth £5.0tn, equivalent to 51pc of the total value of the UK.
However, the growth of land value slowed last year to a 5.9pc increase, compared with rises of 15pc in 2014 and 10pc in 2015.
The ONS noted that land values remain highly dependent on house prices. In 2008 land lost 23pc of its value, some 23pc, as the housing market tumbled. For several years ahead of the crash, land as an asset grew by 18.3pc in value.
The Government was the least valuable sector in the UK, with a value of negative £845bn. This was driven by central government’s massive debt. It was £1.2tn in the red, contrasting with local government which was £356bn in the black.
Since 1995 the value of land has increased more than fivefold, making it our most valuable asset. At £5tn, it accounts for just over half of the total net worth of the UK at end-2016.
Another month, guess what, take a lucky guess, it is the same old story, HM Government, spends more money than it receives via taxes and duties. Another deficit month, thus to bridge the gap, needs to borrow on the bond market.
In December 2017 , the HM Government had to borrow money to meet the difference between tax revenues and public sector expenditure. The term for this is The PSNCR: The Public Sector Net Cash Requirement.
There were “only” 3 auctions of Gilts (UK Government Bonds) by the UK Debt Management Office (http://www.dmo.gov.uk/) to raise cash for HM Treasury:-
13-Dec-2017 0 1/8% Index-linked Treasury Gilt 2036 3 months £800.0000 Million
07-Dec-2017 1½% Treasury Gilt 2047 £2,276.5000 Million
05-Dec-2017 0¾% Treasury Gilt 2023 £2,750.0000 Million
When you add the cash raised:-
∑(£800.0000 Million + £2,276.5000 Million + £2,750.0000 Million) = £5826.5 Million
Million
£5826.5 Million = £5.8265 Billion
On another way of looking at it, is in the 31 days in December, HM Government borrowed:-
£187 million each day for the 31 days.
We are fortunate, while the global banking and financial markets still has the confidence in HM Government to buy the Gilts (Lend money to the UK), the budget deficit keeps rising. What is also alarming, is the dates these bond mature 2023, 2036 and 2047. All long term borrowings, we are mortgaging our futures, but at least “We Are In It Together….”
Cash is king. Cash is liquidity, but actually it can be a very value eroding investment, as inflation (rising prices) can devalue and erode the purchasing power of cash
A real example of the risk of holding cash in an pension fund is here:-
http://factsheets.financialexpress.net/SLEFL/EUY4_RX.pdf
The Standard Life L&G Cash Pension Fund
The table below shows the fall in value of the fund. Grim reading.
The Vanguard U.S. Government Bond Index Fund is an fixed income index fund
Total assets of £366.6 Million
Holds 348 Bonds
GIVE me a one-handed economist,” demanded a frustrated American president, Harry Truman, “All my economists say, ‘on the one hand…on the other’
http://www.economist.com/node/2208841
The Aberdeen New India Investment Trust PLC is a London listed £270 Million investment trust.
http://www.aberdeen-newindia.co.uk/itnewindia/
The objective, to achieve long-term capital appreciation by investing in companies which are incorporated in India or which derive significant revenue or profit from India, with dividend yield from the company being of secondary importance.
Housing Development Finance Corp 9.7% of the fund
Infosys Ltd. 6.9% of the fund
Tata Consultancy Services 6.6% of the fund
Piramal Healthcare Ltd. 5.3% of the fund
ITC, Ltd. 5.2% of the fund
Kotak Mahindra Bank 4.6% of the fund
Grasim Industries Ltd 4.0% of the fund
Hindustan Unilever Ltd. 3.9% of the fund
Godrej Consumer Products 3.6% of the fund
Kansai Nerolac Paints Ltd. 3.5% of the fund
Total 53.1%
Interesting fact:-
Price: 455.50
Net Asset Value: 513.57
Premium/-Discount: -11.31
thus you are buying assets of £5.13 for the price of £4.55
http://www.shareshop.hsbc.co.uk/shareshop/security.cgi?csi=50888&action=
Their is massive speculation on the deal, of AT&T buying Time Warner
http://www.bbc.co.uk/news/business-42058846
The world’s leading telecoms and media group is BT plc
Close behind is AT&T.
The revenues are huge:
https://www.stock-analysis-on.net/NYSE/Company/ATT-Inc/Analysis/Revenues
163,786 million.
That is $163 Billion.
The FTSE Small Cap Index is this:
And these are the companies:-
AAIF Aberdeen Asian Income Fund
AAS Aberdeen Asian Smaller Companies Investment Trust
ABD Aberdeen New Dawn Investment Trust
ADIG Aberdeen Diversified Income And Growth Trust
AEFS Alcentra European Floating Rate Income Fund Red
AEP Anglo-Eastern Plantations
ALM Allied Minds
ANII Aberdeen New India Investment Trust Ord 25p
AO. AO World
APAX Apax Global Alpha
ARW Arrow Global Group
ASIT Aberforth Split Level Income Trust Ord 1p
ATR Asian Total Return Investment Company
ATS Artemis Alpha Trust
ATT Allianz Technology Trust Ord 25p
AVON Avon Rubber
BBGI BBGI Sicav S.A.
BBH Bb Healthcare Trust Red Ord 1p
BEE Baring Emerging Europe
BGFD Baillie Gifford Japan Trust (the)
BGS Baillie Gifford Shin Nippon
BHGG BH Global Limited GBP
BHMG BH Macro Limited GBP
BIFF Biffa
BIOG Biotech Gwth
BMY Bloomsbury Publishing
BOOT Boot Henry **see BHY**
BOWL Hollywood Bowl Group
BRFI Blackrock Frontiers Investment Trust
BRGE Blackrock Greater Europe Inv Trust
BRLA BlackRock Latin Am
BRNA BlackRock North Amer
BRSC BlackRock Smaller Companies Trust
BRWM Blackrock World Mining Trust
BSIF Bluefield Solar Income Fund
BUT Brunner Investment Trust (the)
CAL Capital & Regional
CAR Carclo
CARR Carrs Group
CGT Capital Gearing Trust
CHG Chemring Group
CIR Circassia Pharmaceuticals
CLG Clipper Logistics
CLIG City of London Investment Group
CLLN Carillion
CMBN Cambian Group
CMCX CMC Markets
CMHY City Merchants High Yield Trust
CMS Communisis
CNCT Connect Group
COST Costain Group
CPR Carpetright
CREI Custodian Reit
CSH W Resources (formerly Caspian Holdings )
CSN Chesnara
CSRT Consort Medical
CTR Charles Taylor
CWD Countrywide
DEB Debenhams
DFS DFS Furniture
DIA Dialight
DIG Dunedin Income Growth Investment Trust
DIGS GCP Student Living
DIVI Diverse Income Trust (The)
DLAR De La Rue
DNDL Dunedin Smaller Companies Investment Trust
DPEU Dp Eurasia N.v. Ord Eur0.12 Di Wi
DSCV Discoverie Group Ord 5p
DVO Devro
EFM Edinburgh Dragon Trust
EGL Ecofin Global Utilities & Infrastructure Trust
EIG EI Group
ENQ EnQuest
EPG EP Global Opportunities Trust
EPIC Ediston Property Investment Company
ESP Empiric Student Property
EUT European Investment Trust
EWI Edinburgh Worldwide Investment Trust
FAN Volution Group
FAS Fidelity Asian Values
FCI F&C Capital & Income Investment Trust
FCIF Funding Circle SME Income Fund
FCRE F&C UK Real Estate Investments
FCS F&C Global Smaller Companies
FDL Findel
FEET Fundsmith Emerging Equities Trust Ord 1p
FENR Fenner
FJV Fidelity Japanese Values
FORT Forterra
FOUR 4imprint Group
FOXT Foxtons Group
FPEO F&C Private Equity Trust
FSFL Foresight Solar Fund
FSTA Fuller Smith & Turner
FSV Fidelity Special Values
GABI GCP Asset Backed Inc Fund
GAW Games Workshop Group
GDWN Goodwin
GEMD Gem Diamonds
GHG Georgia Healthcare Group
GLE Gleeson (M J) Group
GMS Gulf Marine Services
GOCO Gocompare.com Group
GYM The Gym Group
HAN Hansa Trust
HAST Henderson Alternative Strategies Trust
HDIV Henderson Diversified Income
HEAD Headlam Group
HEFT Henderson European Focus Trust
HFEL Henderson Far East Income
HFG Hilton Food Group
HGT HG Capital Trust
HHI Henderson High Income Trust
HINT Henderson International Income Trust
HLCL Helical Bar
HMSF Highbridge Multi-strategy Fund Limited Ord Npv Gbp
HNE Henderson Eurotrust
HNT Huntsworth
HRG Hogg Robinson Group
HSD Hansard Global
HSL Henderson Smaller Companies Investment Trust
HSS HSS Hire Grp
HSW Hostelworld Group
IAT Invesco Asia Trust
IBT International Biotechnology Trust
ICGT ICG Enterprise Trust
IEM Impax Environmental Markets
IIT Independent Investment Trust
IPF International Personal Finance
IPU Invesco Perpetual Uk Smaller Companies Trust
IRV Interserve
ITE ITE Group
IVI Invesco Income Growth Trust
JAI JPMorgan Asian Investment Trust
JCH JPMorgan Claverhouse Investment Trust
JEMI JPMorgan Gbl Emerging Mkts Inc Tst
JESC JPMorgan European Smaller Companies Trust
JETG JPMorgan European Investment Trust Growth
JETI JPMorgan European Investment Trust Income
JFJ JPMorgan Japanese Investment Trust
JLEN John Laing Environmental Assets Group
JMC JPMorgan Chinese Investment Trust
JMF JPMorgan Mid Cap Investment Trust
JMI JPMorgan Smaller Companies Investment Trust
JPGI JPMorgan Global Growth Income
JPS JPMorgan Japanese Smaller Companies Investment Trust
JRS JPMorgan Russian Securities
JUS Jupiter US Smaller Companies
JUSC JPMorgan US Smaller Companies IT
KCOM KCOM Group
KIT Keystone Investment Trust
KLR Keller Group
KMR Kenmare Resources
KNOS Kainos Group
LAM Lamprell
LBOW LCG-Longbow Inv
LIO Liontrust Asset Management
LMI Lonmin
LOOK Lookers
LRD Laird
LSL LSL Property Services
LTI Lindsell Train Investment Trust (the)
LUCE Luceco
LWB Low & Bonar
LWDB Law Debenture Corporation (the)
LWI Lowland Investment Company
LXI Lxi Reit Ord 1p
MAJE Majedie Investments
MCB McBride
MCKS McKay Securities
MCLS Mccoll’s Retail Group
MCP Martin Currie Pacific Trust
MCT Middlefield Canadian INC PCC
MER Mears Group
MGNS Morgan Sindall
MGP Medica Group
MNP Martin Currie Global Portfolio Inv.Trust
MNZS Menzies (John)
MOSB Moss Bros Group
MOTR Motorpoint Group
MPO Macau Property Opportunities Fund
MRCH Merchants Trust (the)
MTC Mothercare
MTE Montanaro European Smaller Co’s Trust
MTU Montanaro Uk Smaller Companies Investment Trust
MUT Murray Income Trust
MXF MedicX Fund
NAIT North American Income Trust (The)
NANO Nanoco Group
NAS North Atlantic Smaller Companies Investment Trust
NCC NCC Group
NCYF CQS New City High Yield Fund
NESF Nextenergy Solar Fund
NTG Northgate
NXR Norcros
OPHR Ophir Energy
OTB On The Beach Group
OXB Oxford BioMedica
OXIG Oxford Instruments
PAC Pacific Assets Trust
PCFT Polar Capital Global Financials Trust
PCGH Polar Capital Global Healthcare Grwth & Inc Tr
PCTN Picton Property Income
PDG Pendragon
PDL Petra Diamonds
PFD Premier Foods
PHI Pacific Horizon Investment Trust
PHP Primary Health Properties
PHTM Photo-Me International
PIN Pantheon International
PMO Premier Oil
POG Petropavlovsk
PRTC PureTech Health
PRV Porvair
PSDL Phoenix Spree Deutschland
PURE PureCircle
RCDO Ricardo
RDL Ranger Direct Lending Fund
RECI Real Estate Credit Investments
RGL Regional Reit Limited
RICA Ruffer Investment Company Limited
RNO Renold
RPS RPS Group
RUS Raven Russia
RWA Robert Walters
SCAM Scottish American Investment Company
SCF Schroder Income Growth Fund
SCP Schroder UK Mid & Small Cap Fund
SDL SDL
SDP Schroder Asiapacific Fund
SDU Schroder Uk Growth Fund
SDY Speedy Hire
SEC Strategic Equity Cap.
SERE Schroder European Real Estate Investment Trust
SERV Servelec Group
SFR Severfield
SIA SOCO International
SJG Schroder Japan Growth Fund
SLET Standard Life Equity Income Trust
SLI Standard Life Investment Property Inc Trust
SLPE Standard Life Private Equity Trust Ord 0.2p
SLS Standard Life UK Smaller Companies Trust
SMIF Twentyfour Select Monthly Income Fund
SOI Schroder Orient
SPO Sportech
SPT Spirent Communications
SQN Sqn Asset Finance Income Fund
SQNX SQN Asset Finance Income Fund
SRE Sirius Real Estate
SREI Schroder Real Estate IT
SST Scottish Oriental Smaller Companies Trust (the)
STCK Stock Spirits Group
STHR SThree
STS Securities Trust Of Scotland
STVG STV Group
SUS S & U
SWEF Starwood European Real Est Fin
TET Treatt
TFIF Twentyfour Income Fund
THRG BlackRockThrogmorton Trust
THRL Target Healthcare Reit
TIGT Troy Income & Growth Trust
TNI Trinity Mirror
TOWN Town Centre Securities
TPT Topps Tiles
TRG TR European Growth Trust
TRI Trifast
TRS Tarsus
TTG TT Electronics
TYMN Tyman
UAI U and I Group
UEM Utilico Emerging Markets
UPGS UP Global Sourcing Holdings
VIN Value And Income Trust
VOF VinaCapital Vietnam Opp. Fund
VP. VP
VSL VPC Specialty Lending Investments
WIN Wincanton
WPC Witan Pacific Investment Trust
XAF Xafinity
XAR Xaar
XPP XP Power
ZTF Zotefoams
The four most dangerous words in investing: ‘this time it’s different.’
– Sir John Templeton
This is one of the most important quotes in investment history. Unfortunately, it’s often misunderstood. Of course, things are always different from one era to the next, but what does not change from era to era is human behaviour and the formation of market extremes.
In the past decade and a half we have had several great examples of investment sector extremes. Remember the gurus that explained the dot-com years by stating it was a new era and the old metrics of valuation did not apply? How about the housing boom? Recall the experts in late 2005 stressing why this time was different, and that the record shattering valuations weren’t a problem?
Identifying extremes is easy in retrospect, but for most investors it’s very difficult in the moment. That’s because the natural human tendency is to chase performance, and the brighter the glow, the more average investors clamour to buy.
Here are a few things to consider regarding equity sector extremes. Timespan is important, extremes take years to develop; a year, two, or even three is typically not enough. The thing to look for is outperformance above the broad market for more than three years. Sectors in a classic bubble formation have usually outperformed for more than four years.
Both the dot-com and housing sectors maintained outperformance for just over five years. For the average investor outperformance for three or four years is an almost irresistible buy, yet history clearly shows us that performance extremes do not last, and when they fail the damage to investors is usually substantial.
The Royal Bank of Scotland.
Reading the half year results from RBS makes intereting reading:-
Total assets of £782,654 Million (£782 Billion)
which is made up of:-
Cash and balances at central banks £86,807m
Net loans and advances to banks £20,685m
Net loans and advances to customers £326,059m
Reverse repurchase agreements and stock borrowing £40,030m
Debt securities and equity shares £86,687m
Derivatives £193,531m
Other assets £28,855m
Total £782,654 Million
That is about 50% of the annual GDP of the UK economy
Cisco is the world leading networking infrastructure supplier.
The financials of Cisco are amazing:-
Look at the cash / near cash on page 68:-
Cash and cash equivalents $ 11,708 million
Investments $ 58,784 million
That is $70,492 Million = $70 Billion
Borrowings (Debt)
Three-month LIBOR plus 0.60% February 21, 2018 $1,000m
Three-month LIBOR plus 0.31% June 15, 2018 $900m
Three-month LIBOR plus 0.50% March 1, 2019 $500m
Three-month LIBOR plus 0.34% September 20, 2019 $500m
Fixed-rate notes:
1.40% February 28, 2018 $1,250m
1.65% June 15, 2018 $1,600m
4.95% February 15, 2019 $2,000m
1.60% February 28, 2019 $1,000m
2.125% March 1, 2019 $1,750m
1.40% September 20, 2019 $1,500m
4.45% January 15, 2020 $2,500m
2.45% June 15, 2020 $1,500m
2.20% February 28, 2021 $2,500m
2.90% March 4, 2021 $500m
1.85% September 20, 2021 $500m
3.00% June 15, 2022 $500m
2.60% February 28, 2023 $500m
2.20% September 20, 2023 $750m
3.625% March 4, 2024 $1,000m
3.50% June 15, 2025 $500m
2.95% February 28, 2026 %750m
2.50% September 20, 2026 $1,500m
5.90% February 15, 2039 $2,000m
5.50% January 15, 2040 $2,000m
Total $ 30,500m = $30.5 Billion
The Halifax (www.halifax.co.uk) produced a very interesting report on the total value of UK residential housing: £6,015 Billion
The total value of all the houses in the UK has passed the £6tn mark for the first time, according to The Halifax which also highlights the vast concentration of property wealth in London and the south-east. The value of homes in London is now more than all the houses in Scotland, Wales and the north of England combined. The research also reveals how property values in the south have escalated since the financial crash of 2007-08, despite incomes remaining relatively flat. In 2007 Halifax estimated that the UK’s housing stock was worth a total of £4,077bn, but over the past 10 years the figure has risen to £6.015 Trillion
To put the £6tn figure into context, it is nearly four times the size of the UK’s national debt, which is currently just over £1.8tn, and three times our total national output in 2016 (around £2tn). But even if every house in Britain was sold, the money raised would pay off less than half of the US’s national debt.
The big rises in the value of the UK’s housing stock have mostly taken place in the south. In 2007, the value of housing in the north-east was estimated at £114bn, but today it stands at £136bn – an increase of £22bn.
But in London, houses have jumped in value from £718bn in 2007 to £1,338bn today, a gain of £620bn. Over the same period the value of properties in Northern Ireland actually fell.
In total, 68% of private property wealth, amounting to £3.8tn, is concentrated in the south, up from 62% in 2007. The stock of privately owned homes in Britain also increased in number from 21.5m to 23.4m. Among the biggest gainers of property wealth in the south have been landlords and second home owners. Halifax said that while the average rate of owner-occupation in the UK was 63%, it stands at just 48% in London.
The vast majority of housing wealth is owned by the over-55s. Halifax estimated that under 35-year-olds own just 3.3% of the UK’s net property wealth, while the over-55s hold 63.3%.
Aviva plc paid out its November dividend on the 17th Nov 2017
It paid out 8.4p a share.
http://otp.investis.com/clients/uk/avivaplc/rns/regulatory-story.aspx?cid=759&newsid=945856
The total number of voting rights in Aviva plc is 4,011,205,623
So what did the 8.4p dividend cost Aviva PLC ?
Thus:
4,011,205,623 x £0.084 = £336,941,272.33
That is £336m.
That is a yield of over 4.5%.
Yesterday it was announced that Royal Dutch Shell was buying the UK’s First Utility
The news:-
https://www.first-utility.com/press/First-Utility-agrees-sale-of-business-to-Shell
Shell’s purchase of First Utility means, that Shell has aquired 850,000 domestic gas, electric and telecoms customers
The figures for the deal are not public but show’s how Shell is transforming itself it a domestic energy supplier.
850,000 customers, say each are paying £100 a month for Gas and Electric, imagine the new cash flow for Shell:-
£100 a month x 850,000 customers = £85,000,000 a month for Shell, that is £85m cash income a month
Today, BP plc pays out it’s December quarterly dividend.
A dividend of $0.10 a share
http://otp.investis.com/clients/uk/bp_plc/rns/regulatory-story.aspx?cid=233&newsid=956941
$0.10 a share = 7.4435 pence per share.
Now, the total number of voting rights in BP p.l.c. is 19,792,111,166
http://otp.investis.com/clients/uk/bp_plc/rns/regulatory-story.aspx?cid=233&newsid=954328
Thus:-
19,792,111,166 shares x 7.4435 pence per share = £1,473,225,794.64
That is £1.473 Billion in cash paid to shareholders.
That is 6.1% yield.
Tomorrow, Wednesday 20th December Royal Dutch Shell pays out its quarterly dividend.
RDSA Royal Dutch Shell A FTSE 100 $0.47 (35.02p)
RDSB Royal Dutch Shell B FTSE 100 $0.47 (35.02p)
https://irssl.euroinvestor.com/asp/ir/IRM_Shell/ssl2017/NewsRead.aspx?storyid=13739543&ishtml=1
Royal Dutch Shell plc’s capital consists of 4,544,414,617 A shares and 3,745,486,731 B shares, each with equal voting rights. Royal Dutch Shell plc holds no ordinary shares in Treasury.
The total number of A shares and B shares in issue is 8,289,901,348
http://www.shareshop.hsbc.co.uk/shareshop/security.cgi?csi=133655
http://www.shareshop.hsbc.co.uk/shareshop/security.cgi?csi=133755
Now, Shell is paying out 35.02p a share thus:
The total number of A shares and B shares in issue is 8,289,901,348 x 35.02p = £2,903,123,452.07
That is £2.903 Billion. That is a yield of 5.9%
The AIM 100 Index is the 100 companies listed in the London Alternative Market.
The growth in the past 12months is incredible. 20% growth, see the chart below.
The companies are:-
4d pharma PLC
Abcam PLC
accesso Technology Group PLC
Advanced Medical Solutions …
Alliance Pharma PLC
Amerisur Resources PLC
Andrews Sykes Group PLC
Applegreen PLC
Arbuthnot Banking Group PLC
ASOS PLC
Benchmark Holdings PLC
Blue Prism Group PLC
boohoo.com PLC
Breedon Group PLC
Brooks Macdonald Group PLC
Burford Capital Ltd
Camellia PLC
CareTech Holdings PLC
Central Asia Metals PLC
Clinigen Group PLC
Conviviality PLC
Craneware PLC
Crystal Amber Fund Ltd
CVS Group PLC
Dart Group PLC
dotDigital Group PLC
Eco Animal Health Group PLC
Eddie Stobart Logistics PLC
EMIS Group PLC
Falcon Oil & Gas Ltd
Faroe Petroleum PLC
Faron Pharmaceuticals Oy
Fevertree Drinks PLC
First Derivatives PLC
Frontier Developments PLC
Gamma Communications PLC
GB Group PLC
Gooch & Housego PLC
Greencoat Renewables PLC
Highland Gold Mining Ltd
Horizon Discovery Group PLC
Hotel Chocolat Group PLC
Hurricane Energy PLC
Hutchison China Meditech Ltd
IDOX PLC
IG Design Group PLC
Impellam Group PLC
Iomart Group PLC
IQE PLC
James Halstead PLC
Johnson Service Group PLC
Joules Group PLC
Keywords Studios PLC
Learning Technologies Group…
Majestic Wine PLC
Manx Telecom PLC
Mattioli Woods PLC
M&C Saatchi PLC
Midwich Group PLC
Mortgage Advice Bureau (Hol…
M P Evans Group PLC
Mulberry Group PLC
Next Fifteen Communications…
Nichols PLC
Numis Corp PLC
Oakley Capital Investments Ltd
Origin Enterprises PLC
Pan African Resources PLC
Patisserie Holdings PLC
Plus500 Ltd
Polar Capital Holdings PLC
Purplebricks Group PLC
Quixant PLC
Redde PLC
Renew Holdings PLC
Restore PLC
RhythmOne PLC
RWS Holdings PLC
SafeCharge International Gr…
Safestyle UK PLC
San Leon Energy PLC
Scapa Group PLC
Smart Metering Systems PLC
Sound Energy PLC
Staffline Group PLC
Summit Germany Ltd
Taptica International Ltd
Telford Homes PLC
Thorpe (F W) PLC
Time Out Group PLC
UK Oil & Gas Investments PLC
Vertu Motors PLC
Victoria PLC
VinaLand Ltd
Wandisco PLC
Watkin Jones PLC
Xeros Technology Group PLC
XLMedia PLC
YouGov PLC
Young & Co’s Brewery PLC
BlueZest is a new lender on the UK market, financing mortgages for buy to let investors and property developers.
How are they going to finance the mortgages they advance to borrowers ?
The issuance of a bond to raise the funds:-
http://www.bluezest.com/bond-investors/
The BlueZest Secured Retail Bond PLC
http://www.londonstockexchange.com/exchange/news/market-news/market-news-detail/other/13440843.html
On the 22nd of November 2017 BlueZest Secured Retail Bond PLC, a wholly-owned subsidiary of BlueZest Funding Limited, established a £1.5bn secured retail bond programme
Thus raising £1.5b in funding from this bond, secured against the properties they lend the cash from the bond programme.
Interest rate: 5.25% Per Annum
So, raising £1,500,000,000 = £1.5 Billion: How many mortgages could this be ?
if we assume, that each mortgage is £250,000 that BlueZest advance on a property worth £300,000 so the borrow has to put down £50,000 cash deposit, in my rough example:
£1,500,000,000 (funds from the bond issue) / £250,000 (each mortgage) = 6,000 loans funded.
As we come to the end of the year, it worth reflecting the movement in the FTSE-100
http://www.shareshop.hsbc.co.uk/shareshop/security.cgi?csi=50058

From 6750 in Jan 2017 to today at just over 7300. A nice 12month gain, delicious
The UK Flagship index, The FTSE-100: It is worth over £2,000 Billion
AAL Anglo American 19,250.16 £Million
ABF Associated British Foods 23,342.51 £Million
ADM Admiral Group 5,503.03 £Million
AHT Ashtead Group 9,490.28 £Million
ANTO Antofagasta 8,983.62 £Million
AV. Aviva 20,467.53 £Million
AZN AstraZeneca 60,750.35 £Million
BA. BAE Systems 17,576.76 £Million
BAB Babcock International Group 3,515.16 £Million
BARC Barclays 33,032.14 £Million
BATS British American Tobacco 108,460.20 £Million
BDEV Barratt Developments 6,117.24 £Million
BKG Berkeley Group Holdings (The) 5,147.14 £Million
BLND British Land Co 6,301.10 £Million
BLT BHP Billiton 28,386.25 £Million
BNZL Bunzl 7,107.91 £Million
BP. BP 97,217.50 £Million
BRBY Burberry Group 7,311.75 £Million
BT.A BT Group 25,893.33 £Million
CCH Coca-Cola HBC 8,633.83 £Million
CCL Carnival 10,030.13 £Million
CNA Centrica 8,077.91 £Million
CPG Compass Group 23,715.10 £Million
CRDA Croda International 5,618.36 £Million
CRH CRH 21,621.31 £Million
CTEC ConvaTec Group 3,756.34 £Million
DCC DCC 6,351.10 £Million
DGE Diageo 64,036.46 £Million
DLG Direct Line Insurance Group 5,010.50 £Million
EXPN Experian 14,187.34 £Million
EZJ easyJet 5,594.68 £Million
FERG Ferguson 13,303.49 £Million
FRES Fresnillo 9,454.35 £Million
GFS G4S 3,982.17 £Million
GKN GKN 5,320.75 £Million
GLEN Glencore 48,769.38 £Million
GSK GlaxoSmithKline 62,934.53 £Million
HL. Hargreaves Lansdown 7,584.36 £Million
HMSO Hammerson 4,110.89 £Million
HSBA HSBC Holdings 147,240.09 £Million
IAG International Airlines Group 12,568.10 £Million
IHG InterContinental Hotels Group 8,197.13 £Million
III 3i Group 8,743.62 £Million
IMB Imperial Brands 29,271.43 £Million
INF Informa 6,171.80 £Million
ITRK Intertek Group 8,388.27 £Million
ITV ITV 6,432.60 £Million
JMAT Johnson Matthey 5,853.42 £Million
KGF Kingfisher 7,223.94 £Million
LAND Land Securities Group 6,906.49 £Million
LGEN Legal & General Group 15,929.22 £Million
LLOY Lloyds Banking Group ORD 47,520.05 £Million
LSE London Stock Exchange Group 13,057.54 £Million
MCRO Micro Focus International 10,765.59 £Million
MDC Mediclinic International 4,126.72 £Million
MERL Merlin Entertainments 3,601.13 £Million
MKS Marks & Spencer Group 5,079.75 £Million
MNDI Mondi 8,584.59 £Million
MRW Morrison (Wm) Supermarkets 5,081.36 £Million
NG. National Grid 29,790.22 £Million
NMC NMC Health 5,808.70 £Million
NXT Next 6,522.39 £Million
OML Old Mutual Group 9,697.31 £Million
PPB Paddy Power Betfair 7,060.91 £Million
PRU Prudential 48,136.41 £Million
PSN Persimmon 7,811.41 £Million
PSON Pearson 5,702.42 £Million
RB. Reckitt Benckiser Group 45,820.41 £Million
RBS Royal Bank of Scotland Group 33,051.67 £Million
RDSA Royal Dutch Shell 107,248.19 £Million
RDSB Royal Dutch Shell 89,723.14 £Million
REL RELX 18,392.35 £Million
RIO Rio Tinto 47,477.11 £Million
RR. Rolls-Royce Group 15,649.66 £Million
RRS Randgold Resources 6,375.82 £Million
RSA RSA Insurance Group 6,200.38 £Million
RTO Rentokil Initial 5,839.96 £Million
SBRY Sainsbury (J) 5,080.06 £Million
SDR Schroders 7,804.55 £Million
SGE Sage Group (The) 8,360.66 £Million
SGRO Segro 5,480.99 £Million
SHP Shire 33,288.00 £Million
SKG Smurfit Kappa Group 5,555.22 £Million
SKY Sky 16,085.70 £Million
SLA Standard Life Aberdeen 12,787.83 £Million
SMIN Smiths Group 5,854.27 £Million
SMT Scottish Mortgage Investment 6,312.34 £Million
SN. Smith & Nephew 11,422.90 £Million
SSE SSE 13,913.47 £Million
STAN Standard Chartered 24,290.13 £Million
STJ St James’s Place 6,393.75 £Million
SVT Severn Trent 4,943.81 £Million
TSCO Tesco 15,919.93 £Million
TUI TUI AG 7,939.69 £Million
TW. Taylor Wimpey 6,364.01 £Million
ULVR Unilever 51,474.78 £Million
UU. United Utilities Group 5,588.08 £Million
VOD Vodafone Group 59,816.01 £Million
WPG Worldpay Group 8,472.00 £Million
WPP WPP Group 16,511.60 £Million
WTB Whitbread 6,551.99 £Million
Total £2,029,210.01 Million
That is £2.029 TRILLION: The value of the FTSE-100
Another month, guess what, take a lucky guess, it is the same old story, HM Government, spends more money than it receives via taxes and duties. Another deficit month, thus to bridge the gap, needs to borrow on the bond market.
In November 2017, the HM Government had to borrow money to meet the difference between tax revenues and public sector expenditure. The term for this is The PSNCR: The Public Sector Net Cash Requirement.
There were “only” 3 auctions of Gilts (UK Government Bonds) by the UK Debt Management Office (http://www.dmo.gov.uk/) to raise cash for HM Treasury:-
21-Nov-2017 0 1/8% Index-linked Treasury Gilt 2026 £1,000.0000 Million
16-Nov-2017 1¼% Treasury Gilt 2027 £2,722.3200 Million
09-Nov-2017 0¾% Treasury Gilt 2023 £2,750.0000 Million
When you add the cash raised:-
∑(£1,000.0000 Million + £2,722.3200 Million + £2,750.0000 Million) = £6,472.32 Million
£6,472.32 Million = £6.47232 Billion
On another way of looking at it, is in the 30 days in November, HM Government borrowed:-
£215 million each day for the 30 days.
We are fortunate, while the global banking and financial markets still has the confidence in HM Government to buy the Gilts (Lend money to the UK), the budget deficit keeps rising. What is also alarming, is the dates these bond mature 2023, 2026 and 2027. All long term borrowings, we are mortgaging our futures, but at least “We Are In It Together….”
Legal and General.
Look after assets worth £951bn. That is about 67% of UK Annual GDP.
Yesterday, Royal Dutch Shell broke the £200bn valuation:
It is two share listings, Shell A and Shell B
http://www.shareshop.hsbc.co.uk/shareshop/security.cgi?csi=133655
http://www.shareshop.hsbc.co.uk/shareshop/security.cgi?csi=133755
Yesterday:
Shell A was worth: £ 108,862m
Shell B was worth: £ 91,390m
A combined value of £200,252 million = £200.252 Bn.

The Foreign and Colonial Investment Trust is a flagship investment trust listed on the London Stock Exchange.
http://www.fandc.com/foreign-and-colonial-investment-trust/
It dates back to 1868, and allowed small investors to get access to global stock markets.
On Wednesday 1st October it paid out 2.5p per share to shareholders.
http://www.londonstockexchange.com/exchange/news/market-news/market-news-detail/FRCL/13412215.html
The total number of voting rights in the Company is 542,582,345
Thus:
542,582,345 x £0.025 = £13,564,558.63
That is a £13m divident payout.
http://www.shareshop.hsbc.co.uk/shareshop/security.cgi?csi=10192&action=
1.6% yield

The fall in one day was dramatic. Look at the performance over 1 year. A high of 235p to the current low of 138p
http://www.shareshop.hsbc.co.uk/shareshop/security.cgi?csi=10029
Rio Tinto is one of the largest natural resources companies in the world.
Its shares have gone from £30 a share 12months ago to now over £37 a share.

The Bank of England base rate is 0.5%
Getting a decent income on investments in the climate, post financial crisis is hard.
But look at the owner of British Gas plc:
The dividend yield is incredible.
7%
https://www.youtube.com/watch?v=gDiKG8LYfqM
Amazing.
http://womeninfintech.co.uk/wp-content/uploads/2017/11/wif_2017_powerlist.pdf
Alexandra Foster, from BT is in the list, BT [www.bt.com] the world’s leading telecommunications and media corporation.
http://linkedin.com/in/alexandrajfoster
https://www.youtube.com/watch?v=gZMXutj29EE
The Bank of England thinks that 75,000 banking jobs could be lost from The City of London due to the UK leaving The EU.
http://www.bbc.co.uk/news/business-41803604
What could this mean ?
If the average London banker salary is say £80,000 what money will be lost to the UK Treasury in lost income tax ?
So:-
75,000 people x £80,000 = £6,000,000,000 (£6 billion in salaries)
approx 50% of this is paid in Income Tax and National Insurance.
That means immediately a loss of revenue for the UK Treasury of £3,000,000,000
Then the salaries post of tax is used to rent or mortgages or buying food, the cost of living.
All that disposable income is also lost to the UK economy.
75,000 jobs being lost, could mean, £6 Billion lost to the UK economy,
Brexit will result in the UK becoming poorer.
Another month, guess what, take a lucky guess, it is the same old story, HM Government, spends more money than it receives via taxes and duties. Another deficit month, thus to bridge the gap, needs to borrow on the bond market.
In October 2017, the HM Government had to borrow money to meet the difference between tax revenues and public sector expenditure. The term for this is The PSNCR: The Public Sector Net Cash Requirement.
There were “only” 4 auctions of Gilts (UK Government Bonds) by the UK Debt Management Office (http://www.dmo.gov.uk/) to raise cash for HM Treasury:-
24-Oct-2017 0 5/8% Index-linked Treasury Gilt 2042 £650.0000 Million
19-Oct-2017 1¼% Treasury Gilt 2027 £2,599.2400 Million
10-Oct-2017 1¾% Treasury Gilt 2037 £2,500.0000 Million
05-Oct-2017 0¾% Treasury Gilt 2023 £3,162.5000 Million
When you add the cash raised:-
∑(£650.0000 Million + £2,599.2400 Million + £2,500.0000 Million + £3,162.5000 Million) = £8911.74 Million
£8911.74 Million = £8.91174 Billion
On another way of looking at it, is in the 31 days in October, HM Government borrowed:-
£287 million each day for the 31 days.
We are fortunate, while the global banking and financial markets still has the confidence in HM Government to buy the Gilts (Lend money to the UK), the budget deficit keeps rising. What is also alarming, is the dates these bond mature 2042, 2037, 2027 and 2023. All long term borrowings, we are mortgaging our futures, but at least “We Are In It Together….”
Stock market prices are in the financial press. Their is a lot of talk about the global stockmarkets being highly over valued. What is interesting is seeing the valuations of some technology companies.
Lets look at American Telephone and Telegraph (AT&T).
http://www.nasdaq.com/symbol/t
Now lets look at Facebook
http://www.nasdaq.com/symbol/fb
The difference is huge.
AT&T’s market value is: $203,049,800,000 ($203 Billion)
Facebook’s market value is $523,481,434,266 ($523 Billion)
Two huge technology companies, one over 100 years old, and the other is less that 15 years old.
Yet Facebook is worth more than twice that of the telephone giant, AT&T.
https://www.youtube.com/watch?v=o8Dn6bnCMQc
Morrisons PLC paid out its November dividend.
It paid out 1.66p per share, what did this cost Morrisons PLC ?
https://otp.tools.investis.com/clients/uk/morrison/rns/regulatory-story.aspx?cid=623&newsid=946302
The total number of voting rights in Wm Morrison Supermarkets PLC is 2,355,206,626.
Thus:
2,355,206,626 x £0.0166 = £39,096,429.99
That is £39m in cash
http://www.shareshop.hsbc.co.uk/shareshop/security.cgi?csi=10248&action=
That is 2.4% yield.
Facts from the Q3 HSBC Results 2017
The Hong Kong and Shanghai Banking Corporation released its Q3 results on the 30th October.
The numbers are staggering, in the sense the bank is vast.
Total assets $2,526,214 MILLION, yes $2.526 TRILLION
Loans and advances to customers $945,168, yes $945 Billion
Cutomer accounts deposits $1,337,121, yes $1.337 TRILLION
Debt securities in issue $59,740, yes $59 Billion of bonds
https://www.youtube.com/watch?v=EIJqtWUiUCs&app=desktop
The Standard Life Passive Plus III Pension Fund is a fund from Standard Life that is actually a funds of funds.
https://uk.standardlifeinvestments.com/SL_P_Passive_Plus_III.pdf
It is also the default fund that investors (pension savers) with BT, who joined after March 2001, and is given to staff who join the BT Retirement Savings Scheme.
https://www.btretirementsavingscheme.com/bt/
The goal of this fund is to provide long term growth while being managed to a level of risk, rather than a
level of return. The fund is part of the Passive Plus range, which aims to offer five different combinations of
investment risk and return levels
Current Fund Size £2,744.3 Million
SL VANGUARD FTSE UK ALL SHARE INDEX 14.6% of the fund
SL SLI GLOBAL ABSOLUTE RETURN STRATEGIES 13.9% of the fund
SL VANGUARD US EQUITY 13.3% of the fund
SL VANGUARD UK SHORT-TERM INVESTMENT GRADE BOND 10.8% of the fund
SL VANGUARD UK INVESTMENT GRADE BOND INDEX 10.8% of the fund
SL PROPERTY PENSION 6.3% of the fund
SL VANGUARD FTSE DEVELOPED EUROPE EX UK EQUITY INDEX 5.7% of the fund
SL VANGUARD UK GOVERNMENT BOND INDEX 4.9% of the fund
SL VANGUARD JAPAN STOCK INDEX 4.1% of the fund
SL MONEY MARKET PENSION 4.1% of the fund
SL VANGUARD PACIFIC EX JAPAN STOCK INDEX 3.4% of the fund
SL VANGUARD EMERGING MARKETS STOCK INDEX 3.3% of the fund
SL SLI GLOBAL HIGH YIELD BOND 2.8% of the fund
SL GLOBAL PROPERTY SECURITIES ASSET 2.0% of the fund
The performance:
Year to 30/06/2017 (%) 11.0
Year to 30/06/2016 (%) 3.7
Year to 30/06/2015 (%) 5.6
Year to 30/06/2014 (%) 7.2
Year to 30/06/2013 (%) 7.2
You can see year on year growth.
UK Mortgages PLC, an investment fund that buys residential mortgages, managed by TwentFour Asset Management pays out its quarterly dividend.
https://twentyfouram.com/funds/uk-mortgages-fund/
The dividend is 1.5p a share on the 31st October (today)
http://www.londonstockexchange.com/exchange/news/market-news/market-news-detail/UKML/13393822.html
250,000,000 shares in issue:
Thus:
£0.015 x 250,000,000 = £3,750,000.00
That is £3.75million in dividends.
http://content.prnewswire.com/documents/PRNUK-1509171649-CA52_UKML_Factsheet_-_July_2017_CC.pdf
https://www.youtube.com/watch?v=mOS4wAsBnvM
The newly merged company, of Standard Life and Aberdeen Asset Management has issued debt to fund its business
https://www.standardlifeaberdeen.com/
Various debt instruments are issued (bonds)
https://www.standardlifeaberdeen.com/investors/for-debt-investors
| Issuer | Guarantor | Instrument rating | Nominal | Issue Date | First Call Date | Maturity | Coupon |
|---|---|---|---|---|---|---|---|
| Standard Life plc | Standard Life Assurance Ltd | A3 / A- / – | £500m | July 2002 | July 2027 | PerpNC25 | 6.75% |
| Standard Life plc | Standard Life Assurance Ltd | Baa1 / A- / – | £300m | November 2004 | January 2020 | PerpNC15 | 6.546% |
| Standard Life plc | – | Baa1/ BBB+ / – | £500m | December 2012 | December 2022 | 30NC10 | 5.5% |
| Aberdeen Asset Management plc | – | – / – / BBB | $500m | March 2013 | March 2018 | PerpNC5 | 7.0% |
| Issuer / Bond | Launch Date | Size | Historical Prospectus |
|---|---|---|---|
| Standard Life plc | July 2002 | £500m | Offering Circular for Standard Life plc (GBP) – Jul-02 – (335KB) |
| Standard Life plc | November 2004 | £300m | Offering Circular for Standard Life plc (GBP) – Nov-04 – (431KB) |
| Standard Life plc | December 2012 | £500m | Drawdown Prospectus – (410KB) |
| Aberdeen Asset Management plc | March 2013 | $500m | Prospectus for Aberdeen Asset Management plc 7% Perpetual Cumulative Capital Notes – (328KB) |

https://www.youtube.com/watch?v=r2dGl-2OEsk
The FinTech sector has loads of new companies offering financial solutions to the time poor who can now use automated systems to buy investments.
is a new one that has just been taken over by Aviva PLC
https://www.aviva.com/media/news/item/aviva-to-make-strategic-investment-in-wealthify-17830/
Platforms like Wealthify are “Robot Investors” that invest client money into collective investments like Unit Trusts, and use various different types of asset classes and different types of funds
They spread the risk over these types of assets:-
Alternatives – 7%
Cash – 2%
Commodities – 11%
Corporate Bonds – 6%
Government Bonds – 12%
Property – 4%
Shares – 58%
Funds from investment companies such as:
Vanguard
Aberdeeen Asset Management
Henderson Janus
Fidelity
Legal and General
Blackrock
iShares
Yesterday, Standard Life Aberdeen paid out its maiden dividend.
https://www.standardlifeaberdeen.com/
This is the merger of Aberdeen Asset Management and Standard Life
The dividend is 7p per share.
The total number of voting rights in the Company, as at 29 September 2017, is therefore 2,977,315,478.
Thus:-
2,977,315,478 x £0.07 = £208,412,083.46
That is £208m
http://www.shareshop.hsbc.co.uk/shareshop/security.cgi?csi=186960
The Supermarket Income REIT plc is a London Listed investment trust owning Supermarket real estate, that it gets an income from the rent the supermarket pays.
https://www.supermarketincomereit.com/
Currently they own 3 supermarkets:
https://www.supermarketincomereit.com/portfolio-overview
Sainsbury’s, Ashford, Address: Simone Weil Ave, Ashford TN24 8YN
[Supermarket Income REIT acquired the property in August 2017 for £80.0 million, reflecting a net initial yield of 4.5%]
Tesco, Thetford, Address: Kilverstone, Thetford, Norfolk IP24 2RL
[Supermarket Income REIT acquired the property in August 2017 for £43.2 million, reflecting a net initial yield of 5.4% or 5.6% after the agreed RPI-linked rent review in December 2017.]
Tesco, Bristol, Address: Lime Trees Rd, Bristol BS6 7XW
[Supermarket Income REIT acquired the property in August 2017 for £28.5 million, reflecting a net initial yield of 4.9%. ]
http://www.shareshop.hsbc.co.uk/shareshop/security.cgi?csi=54589400
£99m market capitalisation
http://www.londonstockexchange.com/exchange/news/market-news/market-news-detail/SUPR/13378063.html
A dividend declared of 1.375p. They plan a quarterly dividend.
On Tuesday 12th Oct, GlaxoSmithKline paid out its October dividend to shareholders.
The dividend was 19p per share.
What did this cost GSK plc ?
The total number of voting rights in the Company is 4,918,631,170
Thus:-
4,918,631,170 x £0.19 = £934,539,922.30
That is £934m
http://www.shareshop.hsbc.co.uk/shareshop/security.cgi?csi=10042
5% yield.
The TechMark Index is London’s technology index.
http://www.shareshop.hsbc.co.uk/shareshop/security.cgi?csi=50149
It has grown over the past 5 years from:
2021 5 years ago, to today at over 3400
