The Investment in Love and Care
Leave a reply
https://www.youtube.com/watch?v=r9b3vOcu3oY
The Henderson Alternative Strategies Trust PLC is a London listed £115m Investment Trust.
https://www.janushenderson.com/ukpi/fund/320
Managed by Henderson Janus, it invests in diversified, international, multi-strategy portfolio which offers access also to specialist funds including hedge and private equity
http://www.shareshop.hsbc.co.uk/shareshop/security.cgi?csi=13411
It’s top ten holdings are:
5.9% Blackrock European Hedge Fund
5.1% Ceiba Investment Ltd
4.9% Riverstone Energy
4.7% Schroder Gaia Indus Pacific Choice
4.6% Mantra Investissement
4.0% Majedie Tortoise Investmetn
3.9% Baring Vostock Inv PCC Core
3.9% Summit Germany
3.8% Helium Fund Select S
3.7% Gensis Emerging Markets
What is interesting is this:
Shareprice = £2.95
Asset Price = £3.30
Thus you are able to buy assets worth £3.30 for £2.95…… that is a big discount.
Another month, guess what, take a lucky guess, it is the same old story, HM Government, spends more money than it receives via taxes and duties. Another deficit month, thus to bridge the gap, needs to borrow on the bond market.
In September 2017, the HM Government had to borrow money to meet the difference between tax revenues and public sector expenditure. The term for this is The PSNCR: The Public Sector Net Cash Requirement.
There were “only” 3 auctions of Gilts (UK Government Bonds) by the UK Debt Management Office (http://www.dmo.gov.uk/) to raise cash for HM Treasury:-
27-Sep-2017 0 1/8% Index-linked Treasury Gilt 2036 £950.0000 Million
19-Sep-2017 1½% Treasury Gilt 2047 £2,500.0000 Million
13-Sep-2017 1¼% Treasury Gilt 2027 £2,500.0000 Million
When you add the cash raised:-
∑(£950.0000 Million + £2,500.0000 Million + £2,500.0000 Million) = £5,950 Million
Million
£5,950 Million Million = £5.950 Billion
On another way of looking at it, is in the 30 days in June, HM Government borrowed:-
£198 million each day for the 30 days.
We are fortunate, while the global banking and financial markets still has the confidence in HM Government to buy the Gilts (Lend money to the UK), the budget deficit keeps rising. What is also alarming, is the dates these bond mature 2027, 2036 and 2047. All long term borrowings, we are mortgaging our futures, but at least “We Are In It Together….”
The FTSE-100 Pharma Company Astra Zeneca paid out its September Dividend.
68.9p per share.
The total number of voting rights in AstraZeneca PLC is 1,265,794,991
Thus:-
1,265,794,991 x £0.689 per share = £872,132,748.80
That is £872million
A yield of over 4.7%
FTSE 100 Index is a market-capitalisation weighted index of UK-listed blue chip companies.
http://www.shareshop.hsbc.co.uk/shareshop/security.cgi?csi=50058
It is made up of these sectors:
Oil & Gas 3 Companies who total market capitalisation is £261,815 Million 13.71% of the FTSE-100
Chemicals 2 Companies who total market capitalisation is £10,113 Million 0.53% of the FTSE-100
Basic Resources 8 Companies who total market capitalisation is £154,949 Million 8.12% of the FTSE-100
Construction & Materials 1 Company who total market capitalisation is £22,673 Million 1.19% of the FTSE-100
Industrial Goods & Services 15 Companies who total market capitalisation is £128,229 Million 6.72% of the FTSE-100
Automobiles & Parts 1 Company who total market capitalisation is £5,467 Million 0.29% of the FTSE-100
Food & Beverage 3 Companies who total market capitalisation is £80,680 Million 4.23% of the FTSE-100
Personal & Household Goods 8 Companies who total market capitalisation is £269,391 Million 14.11% of the FTSE-100
Health Care 6 Companies who total market capitalisation is £184,553 Million 9.67% of the FTSE-100
Retail 6 Companies who total market capitalisation is £41,454 Million 2.17% of the FTSE-100
Media 6 Companies who total market capitalisation is £61,907 Million 3.24% of the FTSE-100
Travel & Leisure 9 Companies who total market capitalisation is £77,673 Million 4.07% of the FTSE-100
Telecommunications 2 Companies who total market capitalisation is £83,413 Million 4.37% of the FTSE-100
Utilities 5 Companies who total market capitalisation is £70,410 Million 3.69% of the FTSE-100
Banks 5 Companies who total market capitalisation is £257,187 Million 13.47% of the FTSE-100
Insurance 8 Companies who total market capitalisation is £115,197 Million 6.03% of the FTSE-100
Real Estate 4 Companies who total market capitalisation is £23,751 Million 1.24% of the FTSE-100
Financial Services 7 Companies who total market capitalisation is £47,625 Million 2.49% of the FTSE-100
Technology 2 Companies who total market capitalisation is £12,521 Million 0.66% of the FTSE-100
Totals 101 Companies, total vaue £1,909,009 Million 100.00% of the FTSE 100 Index.
That is £1.9 Trillion.
The Vanguard U.S. Investment Grade Credit Index Fund is a world class fixed income fund.
The Fundamentals of the fund
Number of bonds 6,306
Effective Yield To Maturity 2.9%
Average coupon 3.8%
Average maturity 9.3 years
Average quality A
Average duration 6.5 years
Cash investments 0.6%.
The Fund holds:
AAA 13.6%
AA 11.0%
A 32.8%
BBB 40.6%
Less than BBB 0.0%
Not Rated 2.0%
Total 100%
Assets of the fund:-
Corporate-Industrial 41.4%
Corporate-Financial Institutions 24.3%
Gov-Related-Agency 10.3%
Gov-Related-Sovereign 4.8%
Corporate-Utility 4.8%
Gov-Related-Supranational 4.1%
Securitized-Commercial Mortgage Backed Security 3.7%
Gov-Related-Local Authority 3.0%
Securitized-Asset Backed Security 1.7%
Treasury 1.3%
Cash 0.6%
Securitized-Mortgage Backed Security Pass-through 0.0%
Other 0.0%
Total 100.0%
Legal and General plc is the giant FTSE-100 Life Insurer and Investment Manager.
http://www.legalandgeneral.com
The yield is incredible.
http://www.shareshop.hsbc.co.uk/shareshop/security.cgi?csi=10055&action=
https://www.youtube.com/watch?v=weAUQIZG9xU
The Reserve Bank of India published it latest annual report.
https://www.rbi.org.in/scripts/AnnualReportPublications.aspx
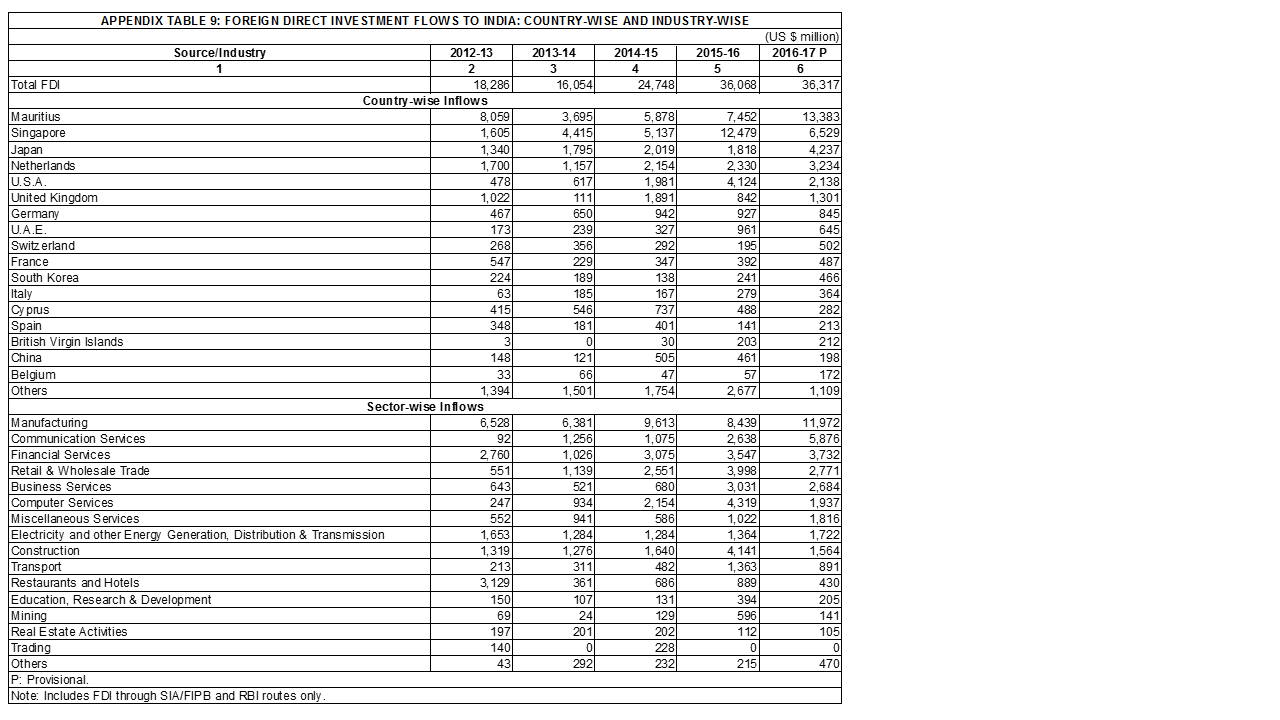
Interesting to see the statistics on Foreign Direct Investment in India.
https://www.rbi.org.in/scripts/AnnualReportPublications.aspx?Id=1221
The United Kingdom in the 6th Largest Investor in India with last year an investment of $1,301m into India.
The table below shows India’s largest investors, $
| APPENDIX TABLE 9: FOREIGN DIRECT INVESTMENT FLOWS TO INDIA: COUNTRY-WISE AND INDUSTRY-WISE | |||||
| (US $ million) | |||||
| Source/Industry | 2012-13 | 2013-14 | 2014-15 | 2015-16 | 2016-17 P |
| 1 | 2 | 3 | 4 | 5 | 6 |
| Total FDI | 18,286 | 16,054 | 24,748 | 36,068 | 36,317 |
| Country-wise Inflows | |||||
| Mauritius | 8,059 | 3,695 | 5,878 | 7,452 | 13,383 |
| Singapore | 1,605 | 4,415 | 5,137 | 12,479 | 6,529 |
| Japan | 1,340 | 1,795 | 2,019 | 1,818 | 4,237 |
| Netherlands | 1,700 | 1,157 | 2,154 | 2,330 | 3,234 |
| U.S.A. | 478 | 617 | 1,981 | 4,124 | 2,138 |
| United Kingdom | 1,022 | 111 | 1,891 | 842 | 1,301 |
| Germany | 467 | 650 | 942 | 927 | 845 |
| U.A.E. | 173 | 239 | 327 | 961 | 645 |
| Switzerland | 268 | 356 | 292 | 195 | 502 |
| France | 547 | 229 | 347 | 392 | 487 |
| South Korea | 224 | 189 | 138 | 241 | 466 |
| Italy | 63 | 185 | 167 | 279 | 364 |
| Cyprus | 415 | 546 | 737 | 488 | 282 |
| Spain | 348 | 181 | 401 | 141 | 213 |
| British Virgin Islands | 3 | 0 | 30 | 203 | 212 |
| China | 148 | 121 | 505 | 461 | 198 |
| Belgium | 33 | 66 | 47 | 57 | 172 |
| Others | 1,394 | 1,501 | 1,754 | 2,677 | 1,109 |
| Sector-wise Inflows | |||||
| Manufacturing | 6,528 | 6,381 | 9,613 | 8,439 | 11,972 |
| Communication Services | 92 | 1,256 | 1,075 | 2,638 | 5,876 |
| Financial Services | 2,760 | 1,026 | 3,075 | 3,547 | 3,732 |
| Retail & Wholesale Trade | 551 | 1,139 | 2,551 | 3,998 | 2,771 |
| Business Services | 643 | 521 | 680 | 3,031 | 2,684 |
| Computer Services | 247 | 934 | 2,154 | 4,319 | 1,937 |
| Miscellaneous Services | 552 | 941 | 586 | 1,022 | 1,816 |
| Electricity and other Energy Generation, Distribution & Transmission | 1,653 | 1,284 | 1,284 | 1,364 | 1,722 |
| Construction | 1,319 | 1,276 | 1,640 | 4,141 | 1,564 |
| Transport | 213 | 311 | 482 | 1,363 | 891 |
| Restaurants and Hotels | 3,129 | 361 | 686 | 889 | 430 |
| Education, Research & Development | 150 | 107 | 131 | 394 | 205 |
| Mining | 69 | 24 | 129 | 596 | 141 |
| Real Estate Activities | 197 | 201 | 202 | 112 | 105 |
| Trading | 140 | 0 | 228 | 0 | 0 |
| Others | 43 | 292 | 232 | 215 | 470 |
| P: Provisional. | |||||
| Note: Includes FDI through SIA/FIPB and RBI routes only. | |||||
36,317million.
Yesterday, Fri 22nd Sept 2017, the oil major BP, paid its shareholders its September dividend.
It was $0.10 a share = 7.6213p a share.
What did that cost BP ?
The total number of voting rights in BP p.l.c. is 19,757,724,586
http://otp.investis.com/clients/uk/bp_plc/rns/regulatory-story.aspx?cid=233&newsid=912897
Thus:-
19,757,724,586 x 7.6213p = £1,505,795,463.87
That is £1,505 Million = £1.505 Billion
That is a yield of over 6%.
The risks of weak financial regulation
https://www.youtube.com/watch?v=b2q3sdJvNpU
The objective of Aberdeen New Dawn Investment Trust PLC is to provide shareholders
with a high level of capital growth through equity investment in the Asia Pacific
countries excluding Japan.
http://www.newdawn-trust.co.uk/itnewdawn/
Its top ten holdings are:-
Aberdeen Global-Indian EquityC (India) 12.6% of the fund
Samsung Electronics Pref (Korea) 4.8% of the fund
Jardine Strategic (Hong Kong) 4.7% of the fund
Aberdeen Global – China A Share (China) 4.3% of the fund
Oversea-Chinese Banking Corp. (Singapore) 4.1% of the fund
TSMC (Taiwan) 3.6% of the fund
AIA (Hong Kong) 3.4% of the fund
Ayala Land (Philippines) 3.3% of the fund
City Developments (Singapore) 2.9% of the fund
Rio Tinto (Australia) 2.6% of the fund
Total of the top ten make up 46.3% of the fund
Fundamentals:-
Gross assets £332.7m
Debt £29.1m
Cash £1.3m
http://www.shareshop.hsbc.co.uk/shareshop/security.cgi?csi=10651&action=
A yield of 1.7% in a climate of UK interest rates of 0.25%

The 2 Long Term Investors: Asad & Ayana Karim
The Jupiter India Fund is a UK based Unit Trust investing in India and beyond. The Fund aims to achieve long-term capital growth. It will invest primarily in companies which operate or reside in India. It may also invest in companies based in
Pakistan, Sri Lanka and Bangladesh and in companies which derive a significant proportion of business from or within India.
Top Ten Holdings
Hindustan Petroleum 7.1% of the fund
Godfrey Phillips India 4.3% of the fund
Biocon 3.5% of the fund
State Bank of India 3.1% of the fund
Interglobe Aviation 2.9% of the fund
Reliance Capital 2.5% of the fund
Infosys 2.4% of the fund
Bharat Petroleum 2.4% of the fund
Gillette India 2.2% of the fund
Indian Oil 2.2% of the fund
Total 32.5%
Fund Value: £1,087m
The Royal Sun Alliance Group is a large UK non-life insurer.
It has a debt programme to help fund its operations
http://www.rsagroup.com/investors/bond-investors/
The outstanding debt that is issued in bonds by RSA Group is:-
Total loan capital £1,254 Million.
This is made up of:-
£5m in Subordinated guaranteed US$ bonds [The rate of interest payable on the bonds is 8.95%]
£359m Perpetual guaranteed subordinated securities [rate of interest payable is 6.701%]
£496m Guaranteed subordinated step-up notes due 2039 [bear interest at a fixed rate of 9.375%]
£394m Guaranteed subordinated notes due 2045 (GBP) [bear a fixed rate of 5.125%]
One can see the debt holders (bond holders) are getting a massive interest rate (coupon) for holding RSA Debt.
The FTSE-All Share is a large Index that represents 639 Companies.
The 19 sector components that make up the index are:-
Oil & Gas 18 Companies with a market capitalisation of £272,642 Million 11.41% of the index
Chemicals 8 Companies with a market capitalisation of £14,749 Million 0.62% of the index
Basic Resources 22 Companies with a market capitalisation of £167,331 Million 7.00% of the index
Construction & Materials 16 Companies with a market capitalisation of £35,867 Million 1.50% of the index
Industrial Goods & Services 95 Companies with a market capitalisation of £231,185 Million 9.67% of the index
Automobiles & Parts 1 Company with a market capitalisation of £5,467 Million 0.23% of the index
Food & Beverage 15 Companies with a market capitalisation of £91,942 Million 3.85% of the index
Personal & Household Goods 26 Companies with a market capitalisation of £289,646 Million 12.12% of the index
Health Care 22 Companies with a market capitalisation of £202,368 Million 8.47% of the index
Retail 35 Companies with a market capitalisation of £72,998 Million 3.05% of the index
Media 22 Companies with a market capitalisation of £79,443 Million 3.32% of the index
Travel & Leisure 36 Companies with a market capitalisation of £108,052 Million 4.52% of the index
Telecommunications 6 Companies with a market capitalisation of £88,921 Million 3.72% of the index
Utilities 7 Companies with a market capitalisation of £75,035 Million 3.14% of the index
Banks 11 Companies with a market capitalisation of £265,625 Million 11.11% of the index
Insurance 19 Companies with a market capitalisation of £130,918 Million 5.48% of the index
Real Estate 53 Companies with a market capitalisation of £59,442 Million 2.49% of the index
Financial Services 211 Companies with a market capitalisation of £177,522 Million 7.43% of the index
Technology 16 Companies 20 with a market capitalisation of £20,712 Million 0.87% of the index
Totals 639 Companies with the total value of £2,389,866 Million making 100.00% of the index.
That is £2.389 Trillion
https://www.youtube.com/watch?v=7Qo_f7Gzqds
The Junior Oils Trust is a fund that invests in smaller oil companies.
The Fund is managed by Sector Investment Managers Ltd and Marlborough Fund Managers Ltd
https://www.marlboroughfunds.com/
http://www.sectorinvestments.com/
It’s performance since inception has show huge growth and then slump. The investment objective of the Junior Oils Trust is to provide long-term capital growth from a global portfolio of small to medium capitalisation companies specialising in oil exploration and production
http://www.junioroils.com/fund-performance/
Its top ten holdings:-
1. Questerre Energy 11.0% of the fund
2. FAR Ltd 7.1% of the fund
3. Carnarvon Petroleum 5.8% of the fund
4. Africa Oil 5.1% of the fund
5. Ophir Energy 5.0% of the fund
6. Painted Pony 4.9% of the fund
7. Cooper Energy 4.7% of the fund
8. Faroe Petroleum 4.4% of the fund
9. Tamarack Valley 4.4% of the fund
10. Pantheon Resources 4.0% of the fund
This makes up 56.5% of the fund.
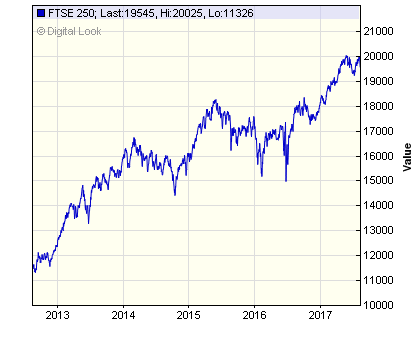
The FTSE-250 is the next biggest index on the London Stock Exchange after the FTSE-100. It represents the next 250 largest companies.
http://www.shareshop.hsbc.co.uk/shareshop/security.cgi?csi=50059
The Ticker Symbol is “MCX”
Look at the growth.
From 12,000 points 5 years ago to today, at 19,600
Another month, guess what, take a lucky guess, it is the same old story, HM Government, spends more money than it receives via taxes and duties. Another deficit month, thus to bridge the gap, needs to borrow on the bond market.
In August 2017, the HM Government had to borrow money to meet the difference between tax revenues and public sector expenditure. The term for this is The PSNCR: The Public Sector Net Cash Requirement.
There were “only” 3 auctions of Gilts (UK Government Bonds) by the UK Debt Management Office (http://www.dmo.gov.uk/) to raise cash for HM Treasury:-
23-Aug-2017 0¾% Treasury Gilt 2023 £3,158.6280 Million
08-Aug-2017 0 1/8% Index-linked Treasury Gilt 2026 £1,000.0000 Million
01-Aug-2017 1¼% Treasury Gilt 2027 £2,250.0000 Million
When you add the cash raised:-
∑(£3,158.6280 Million + £1,000.0000 Million + £2,250.0000 Million) = £6,408.63 Million
Million
£6,408.63 Million = £6.40863 Billion
On another way of looking at it, is in the 31 days in June, HM Government borrowed:-
£206 million each day for the 31 days.
We are fortunate, while the global banking and financial markets still has the confidence in HM Government to buy the Gilts (Lend money to the UK), the budget deficit keeps rising. What is also alarming, is the dates these bond mature 2023, 2026 and 2027. All long term borrowings, we are mortgaging our futures, but at least “We Are In It Together….”
https://www.youtube.com/watch?v=CHPOhdcOU5o
The F&C Global Smaller Companies PLC
The Foreign & Colonial Global Smaller Companies PLC is a London Listed Investment Trust.
http://www.fandc.com/fandc-global-smaller-companies/
A £775m fund. It is a fund of funds, as it holds shares in other investment companies that are investing in global smaller companies.
Its top ten holdings are:-
Eastspring Investments Japan Smaller Companies 4.6%
Aberdeen Global Japanese Smaller Companies 3.9%
Scottish Oriental Smaller Cos Inv Trust 3.0%
Pinebridge Asia ex Japan Small Cap Equity 2.0%
Utilico Emerging Markets 1.6%
HSBC GIF Asia ex Japan Equity Smaller Companies 1.4%
Aberdeen Global Asian Smaller Companies 1.3%
Manulife Global Asian Smaller Companies 1.2%
Alleghany 1.1%
Franklin Financial Network 1.1%
A yield of 0.8%
The Schroder Income Growth Fund plc is a London listed Investment Trust.
It has raised its dividend consistently for the last 21 years.
Its holdings are:-
Assura PLC Ord GBP0.1
AstraZeneca USD0.25
Aviva Ord GBP0.25
BAE Systems Ord GBP0.025
Bellway Ord GBP0.125
BP Plc Ord USD0.25
British American Tobacco Ord GBP0.25
BT Group Ord GBP0.05
Burberry Group Ord GBP0.0005
Centrica Ord GBP0.061728
Daily Mail & General Trust Ord NV GBP0.125
ENI EUR1
Galp Energia SGPS SA-B EUR1
GlaxoSmithKline Ord GBP0.25
Greencore Group Plc EUR0.01
Halfords Group Ord GBP0.01
HSBC Holdings Ord USD0.50
IMI Plc Ord GBP0.2857
Imperial Brands Plc Ord GBP0.10
Intermediate Capital Group PLC Ord GBP0.2625
ITV Ord GBP0.10
John Laing Group PLC WI Ord GBP0.10
John Wood Group Ord GBP0.04285714
Laird Ord GBP0.28125
Legal & General Ord GBP0.025
Lloyds Banking Group Ord GBP0.1
London Stock Exchange Group GBP0.069186
Micro Focus International Ord GBP0.1
NEX Group Plc GBP0.175
Nordea NPV
Pearson Ord GBP0.25
Prudential Ord GBP0.05
Relx PLC Ord GBP0.1444
Rio Tinto Ord GBP0.10
Roche Holding Gsh NPV
Royal Dutch Shell ‘A’ EUR0.07
Royal Dutch Shell ‘B’ EUR0.07
Smurfit Kappa Group (LN) EUR0.001
Taylor Wimpey GBP0.01
TP Icap Plc Ord GBP0.25
Unilever Ord GBP0.031
Unite Group Ord GBP0.25
Vodafone Group Ord USD0.2095238
Total market value of investments £225,977,655
A yield of over 3.5%
On Friday 25th August, Greencoat UK Wind PLC paid out its August dividend. A member of the FTSE-250 Index.
http://www.greencoat-ukwind.com/
A dividend of 1.6225p per share.
The total voting rights in UK Greencoat Wind is 736,700,850
http://otp.investis.com/clients/uk/greencoat/rns/regulatory-story.aspx?cid=2184&newsid=858924
Thus the cost of the dividend:-
736,700,850 shares x £0.016225 = £11,952,971.29
That is £11million
http://www.shareshop.hsbc.co.uk/shareshop/security.cgi?csi=7013076&action=
A 5% yield.
The British Empire Trust is a London Listed FTSE Investment Fund.
http://www.british-empire.co.uk/
Managed by Asset Value Investors
http://www.assetvalueinvestors.com/
The British Empire Trust plc (“British Empire”) was established in 1889 in order to generate profits for its shareholders by investing in the shares of other companies
today is has assets of over £750 million
http://www.shareshop.hsbc.co.uk/shareshop/security.cgi?csi=11153
A yield of over 1.6%
It’s top 30 holdings are:-
Wendel Investment Holding Company 1.28% holding 6.25% of the fund
Jardine Strategic Investment Holding Company 0.16% holding 5.94% of the fund
NB Private Equity Partners Investment Company 9.99% holding 5.27% of the fund
JPEL Private Equity Investment Holding Company 15.58% holding 5.28% of the fund
Investor AB ‘A’ Investment Holding Company 0.47% holding 5.07% of the fund
Riverstone Energy Investment Company 4.57% holding 4.90% of the fund
Pargesa Investment Holding Company 1.10% holding 4.90% of the fund
Symphony International Holdings Investment Company 12.91% holding 4.68% of the fund
Tetragon Financial Investment Company 4.231% holding 4.09% of the fund
Adler Real Estate Real Estate Company 6.88% holding 3.99% of the fund
Aker ASA Investment Holding Company 1.69% holding 3.96% of the fund
Better Capital (2009) Investment Company 17.44% holding 3.81% of the fund
Toyota Industries Investment Holding Company 0.28% holding 3.64% of the fund
Kinnevik AB Investment Holding Company 0.69% holding 3.56% of the fund
AP Alternative Assets Investment Company 1.55% holding 3.47% of the fund
Exor Investment Holding Company 0.31% holding 3.16% of the fund
Hudson’s Bay Retail Holding Company 2.53% holding 3.03% of the fund
Digital Garage Investment Holding Company 3.67% holding 2.93% of the fund
DIC Asset Real Estate Company 4.85% holding 2.70% of the fund
Tokyo Broadcasting Investment Holding Company 0.93% holding 2.60% of the fund
SC Fondul Proprietatea – GDR Investment Company 0.46% holding 2.53% of the fund
Swire Pacific ‘B’ Investment Holding Company 0.56% holding 2.37% of the fund
Vietnam Phoenix Fund ‘C’ Investment Company 22.302% holding 1.93% of the fund
GP Investments Investment Company 14.62% holding 1.74% of the fund
Athene Holding Investment Company 0.25% holding 0.79% of the fund
SC Fondul Proprietatea Investment Company 0.03% holding 0.78% of the fund
Dragon Capital Vietnam Property Real Estate Company 15.4% holding 0.64% of the fund
LMS Capital Investment Company 12.05% holding 0.50% of the fund
Ashmore Global Opportunities – GBP Investment Company 12.572% holding 0.30% of the fund
Dolphin Capital Investors Real Estate Company 2.52% holding 0.18% of the fund
Top thirty investments 94.99 % of the Total Fund
The Carador Income Fund PLC is a London listed investment fund, managed by GSO / Blackstone Debt Funds Management LLC.
The investment objective of Carador Income Fund PLC (the “Company” or “Carador”) is to produce attractive and
stable returns, with low volatility compared to equity markets, by investing in a diversified portfolio of senior notes of
collateralised loan obligations (“CLOs”), collateralised by senior secured bank loans and equity and mezzanine
tranches of CLOs.
Its top ten holdings:-
1. First Data Corp 1.01% of the fund
2. Transdigm 0.80% of the fund
3. Valeant Pharmaceuticals 0.79% of the fund
4. Dell Inc 0.77% of the fund
5. Calpine Corp 0.73% of the fund
6. Univision Communications 0.73% of the fund
7. Centurylink Inc 0.71% of the fund
8. Community Health 0.70% of the fund
9. Albertson 0.68% of the fund
10. Asurion Corp 0.64% of the fund
http://www.shareshop.hsbc.co.uk/shareshop/security.cgi?csi=1927542&action=
UK Student Loans.
The media and politicans have been talking about the level of student debt.
No one can explain properly the level of debt.
Student loan debt in the UK has risen to more than £100bn for the first time, underlining the rising costs young people face in order to get a university education
The reason for the ballon in debt is simple. The rise in student debt has been driven partly by rules introduced in 2012, allowing universities in England to charge up to £9,000 a year in tuition fees
Before 2012, university fees were much lower.
So it began:-
Student loans first became part of the student support package in 1990/91. In that year students could take out a maximum of £420, and then it started to climb on the amount that could be borrowed.
Initially the loans were for living costs, as student tuition fees were paid by the local authorities.
Then over the years changes were made to stop local authorities paying the fees and loans were introduced to pay for the tuition fees, it was in 2006/07 when new students attending institutions in England and Northern Ireland could be charged variable fees of up to £3,000, it was New lending from 2006/07 was subject to a 25-year maximum term after which they are written off.
Then the fees start to rise.
At the end of 2016-17 total publicly owned debt for English students and EU students studying in England was £89.3 billion.
The Government has projected that the outstanding cash value of publicly owned student debt in England will increase to around £100 billion in 2016-17, £500 billion in the mid-2030s and £1,000 billion (£1 trillion) in the late 2040s. The real (2014-15) value is expected to exceed £100 billion around 2018, £200 billion in the late 2020s and stabilize around £300 billion by the middle of this century. These figures assume that fee increase in line with inflation from 2016.
http://researchbriefings.files.parliament.uk/documents/SN01079/SN01079.pdf
The numbers are staggering.
The Vanguard Funds Vanguard S&P 500 ETF is a fund that tracks the USA’s largest Index, the S&P 500.
https://www.vanguardinvestor.co.uk/investments/vanguard-s-and-p-500-ucits-etf/overview-tab
£14,674m of assets in this fund.
Vanguard S&P 500 UCITS ETF seeks to track the performance of the index, a widely recognised benchmark of U.S. stock market performance that is comprised of the stocks of large U.S. companies.
The PIC (Pension Insurance Corporation), is a UK based insuring company, specialising in securing the liabilities of Defined Benefit pension schemes.
At year-end 2016, we had £22.6bn of assets and insured 134,900 pension fund members.
https://www.pensioncorporation.com/
What it does, is to take over the pension responsibility from companies.
So, a company is divested of all responsibility for supporting its pension fund. The pension fund is typically wound up and the trustees discharged, the assets pass across to PIC, which becomes responsible for paying pensions and pension fund members from the company become PIC policyholders following transition period
Thus de-risking the company of its pension liabilities and risks, but also then allowing the company to focus on its core business and passing in responsibility of its pension fund and pensions to the PIC.
There has been a lot of talk in the UK Press about the huge pension deficit in the UK Universities Pension Scheme.
http://www.bbc.co.uk/news/uk-40763577
The Universities Superannuation Scheme (USS) is one of the largest principal private pension schemes in the UK
USS is the principal pension scheme provided by universities and other higher education and associated institutions in the UK. It has over 390,000 members across over 350 institutions.
Net assets of the scheme £60.5 Billion:-
Securities (equities and bonds) £43.5 Billion
Pooled investment vehicles £13.1 Billion
Derivatives (net) £0.2 Billion
Property £2.1 Billion
Cash balances £2.0 Billion
Defined contribution investments £0.5 Billion
Other investment balances £(0.9) Billion
Net assets of the scheme 60.5 Billion
Top 20 assets held:-
Asset Value £m
UK Treasury 0.75% IL 22/03/2034 £1,955.0 Million 3.2% of the fund
UK Treasury 3.25% 22/01/2044 1,161.1 Million 1.9% of the fund
UK Treasury 4.25% 07/03/2036 1,132.3 Million 1.9% of the fund
US Treasury 0.625% IL 15/02/2043 1,009.5 Million 1.7% of the fund
US Treasury 0.75% IL 15/02/2042 908.0 Million 1.5% of the fund
UK Treasury 0.625% IL 22/03/2040 729.3 Million 1.2% of the fund
UK Treasury 1.5% 22/07/2047 690.8 Million 1.1% of the fund
UK Treasury 4.5% 07/09/2034 636.3 Million 1.1% of the fund
US Treasury 1.375% IL 15/02/2044 591.5 Million 1.0% of the fund
Royal Dutch Shell 505.0 Million 0.8% of the fund
UK Treasury 4.25% 07/09/2039 463.8 Million 0.8% of the fund
UK Treasury 0.125% IL 22/03/2044 377.5 Million 0.6% of the fund
Roche Holding 357.7 Million 0.6% of the fund
US Treasury 3.75% 15/08/2041 327.4 Million 0.5% of the fund
US Treasury BOND 3.125% 15/02/2042 307.2 Million 0.5% of the fund
Flughafen Zuerich AG 292.1 Million 0.5% of the fund
Samsung Electronics 290.5 Million 0.5% of the fund
UK Treasury GILT 3.5% 22/07/2068 281.3 Million 0.5% of the fund
US Treasury 2.125% IL 15/02/2040 276.1 Million 0.5% of the fund
Vodafone Group 274.1 0.5% of the fund
https://www.uss.co.uk/~/media/document-libraries/uss/how-uss-is-run/reports-and-accounts/2017-report-and-accounts-scheme.pdf
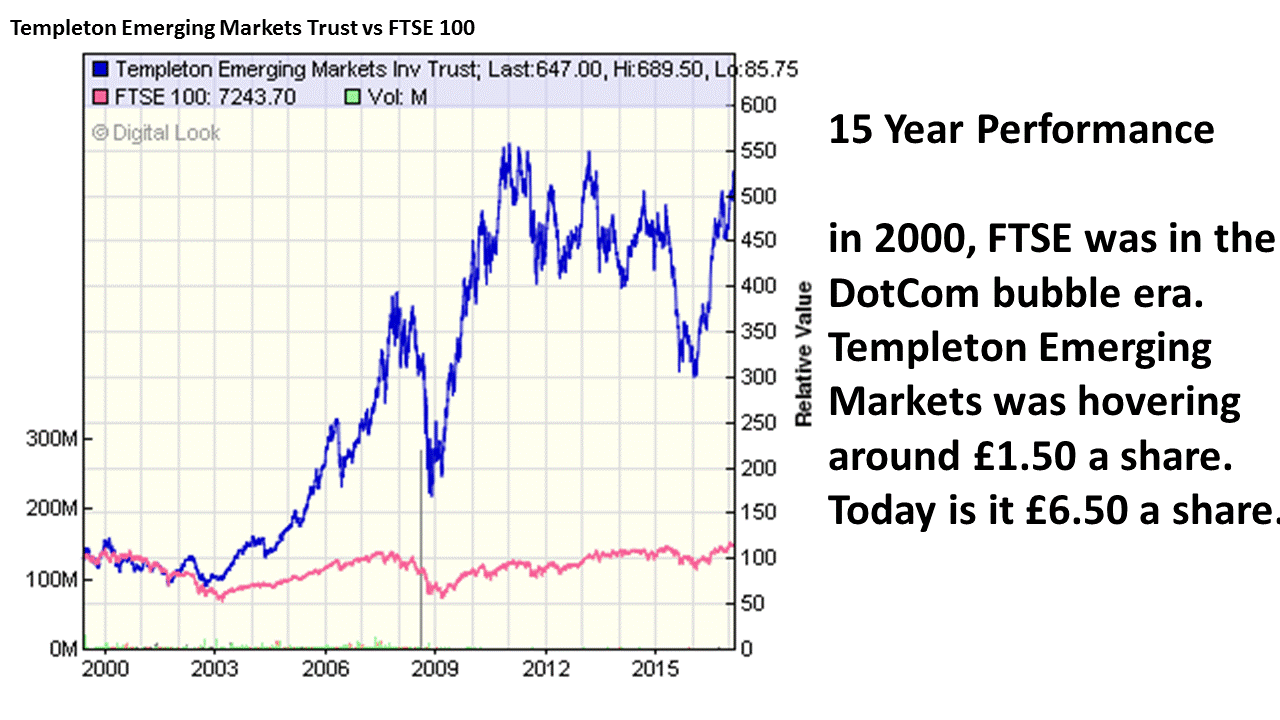
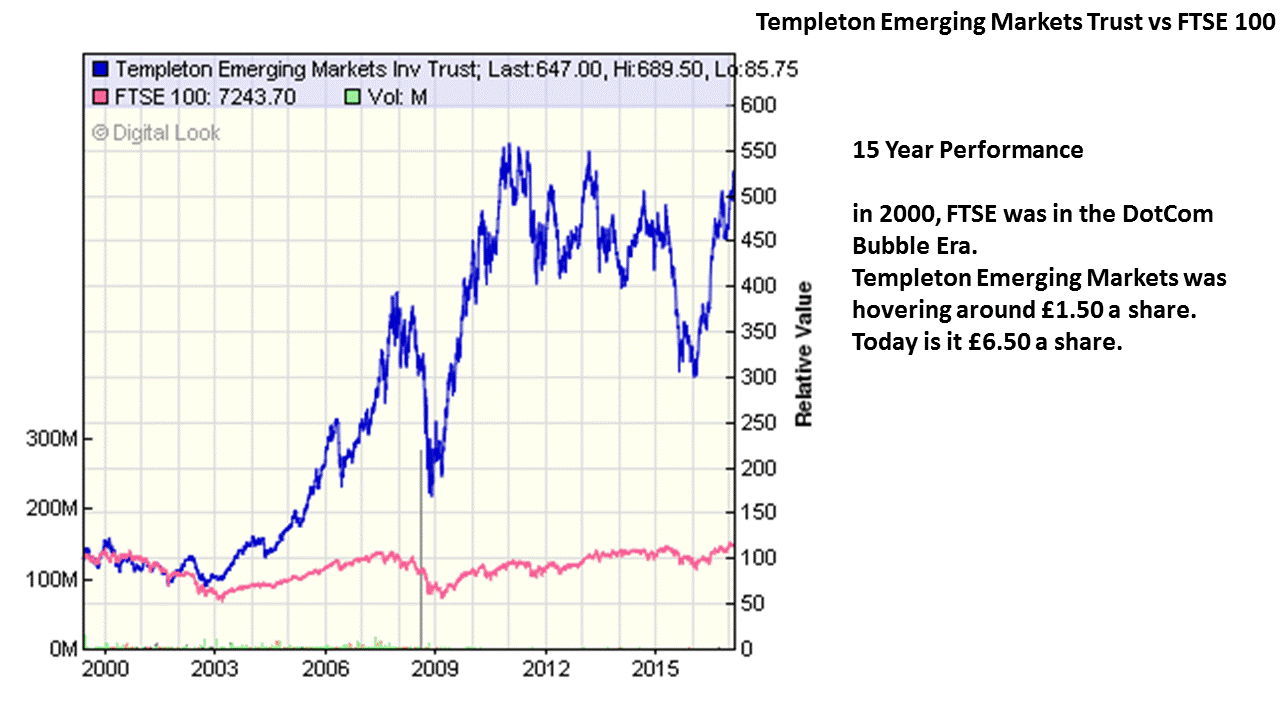
The Templeton Emerging Markets Investment Trust is a very highly regarding London FTSE-250 listed investment trust that is known to be the leader when it comes to Emerging Markets investment.
Top Ten Holdings are:-
SAMSUNG ELECTRONICS CO LTD 7.33%
BRILLIANCE CHINA AUTOMOTIVE HOLDINGS LTD 7.18%
TAIWAN SEMICONDUCTOR MANUFACTURING CO LTD 4.65%
NASPERS LTD 4.59%
TENCENT HOLDINGS LTD 3.87%
UNILEVER PLC 3.83%
ALIBABA GROUP HOLDING LTD 3.37%
HON HAI PRECISION INDUSTRY CO LTD 3.36%
ASTRA INTERNATIONAL TBK PT 2.96%
COMPANIA DE MINAS BUENAVENTURA SA 2.73%
The total investments are:-
| Alibaba, ADR | |
| Shares | 620,130 |
| Market Value (£) | 53,362,555 |
| % of Net Assets | 2.50% |
| América Móvil, ADR | |
| Shares | 640,551 |
| Market Value (£) | 7,243,323 |
| % of Net Assets | 0.30% |
| Astra International | |
| Shares | 125,220,040 |
| Market Value (£) | 64,679,059 |
| % of Net Assets | 3.00% |
| Baidu, ADR | |
| Shares | 93,130 |
| Market Value (£) | 12,820,889 |
| % of Net Assets | 0.60% |
| Bajaj Holdings & Investments | |
| Shares | 269,914 |
| Market Value (£) | 7,206,468 |
| % of Net Assets | 0.30% |
| Banco Bradesco, ADR | |
| Shares | 2,934,490 |
| Market Value (£) | 23,979,872 |
| % of Net Assets | 1.10% |
| Bank Danamon Indonesia | |
| Shares | 143,529,933 |
| Market Value (£) | 40,399,044 |
| % of Net Assets | 1.90% |
| BDO Unibank | |
| Shares | 3,462,737 |
| Market Value (£) | 6,474,183 |
| % of Net Assets | 0.30% |
| Biocon | |
| Shares | 182,745 |
| Market Value (£) | 2,542,995 |
| % of Net Assets | 0.10% |
| Bloomage Biotechnology | |
| Shares | 5,985,500 |
| Market Value (£) | 6,773,118 |
| % of Net Assets | 0.30% |
| BM&F Bovespa | |
| Shares | 2,603,400 |
| Market Value (£) | 12,792,683 |
| % of Net Assets | 0.60% |
| Brilliance China Automotive | |
| Shares | 114,787,131 |
| Market Value (£) | 153,229,778 |
| % of Net Assets | 7.10% |
| Hyundai Wia | |
| Shares | 131,200 |
| Market Value (£) | 6,361,801 |
| % of Net Assets | 0.30% |
| ICICI Bank | |
| Shares | 13,249,076 |
| Market Value (£) | 45,040,562 |
| % of Net Assets | 2.10% |
| iMarketKorea | |
| Shares | 541,353 |
| Market Value (£) | 5,161,052 |
| % of Net Assets | 0.20% |
| IMAX | |
| Shares | 713,959 |
| Market Value (£) | 19,343,155 |
| % of Net Assets | 0.90% |
| Industrias Peñoles | |
| Shares | 174,880 |
| Market Value (£) | 3,592,816 |
| % of Net Assets | 0.20% |
| Infosys Technologies | |
| Shares | 1,468,792 |
| Market Value (£) | 18,478,254 |
| % of Net Assets | 0.90% |
| Inner Mongolia Yitai Coal, B | |
| Shares | 10,020,178 |
| Market Value (£) | 8,875,906 |
| % of Net Assets | 0.40% |
| Interpark | |
| Shares | 1,093,763 |
| Market Value (£) | 3,745,314 |
| % of Net Assets | 0.20% |
| Itaú Unibanco, ADR | |
| Shares | 4,760,326 |
| Market Value (£) | 45,851,994 |
| % of Net Assets | 2.10% |
| Kasikornbank | |
| Shares | 6,036,974 |
| Market Value (£) | 26,507,492 |
| % of Net Assets | 1.20% |
| KCB Group | |
| Shares | 52,782,570 |
| Market Value (£) | 13,482,178 |
| % of Net Assets | 0.60% |
| Kiatnakin Bank | |
| Shares | 16,735,422 |
| Market Value (£) | 27,021,472 |
| % of Net Assets | 1.30% |
| KT Skylife | |
| Shares | 561,550 |
| Market Value (£) | 6,616,812 |
| % of Net Assets | 0.30% |
| Land and Houses | |
| Shares | 59,229,826 |
| Market Value (£) | 13,347,493 |
| % of Net Assets | 0.60% |
| Largan Precision | |
| Shares | 219,000 |
| Market Value (£) | 27,450,248 |
| % of Net Assets | 1.30% |
| Lojas Americanas | |
| Shares | 6,164,020 |
| Market Value (£) | 20,820,737 |
| % of Net Assets | 1.00% |
| LUKOIL, ADR | |
| Shares | 993,100 |
| Market Value (£) | 41,963,646 |
| % of Net Assets | 2.00% |
| M. Dias Branco | |
| Shares | 351,100 |
| Market Value (£) | 11,361,238 |
| % of Net Assets | 0.50% |
| MAHLE Metal Leve | |
| Shares | 1,053,800 |
| Market Value (£) | 5,825,141 |
| % of Net Assets | 0.30% |
| Mail.Ru, GDR | |
| Shares | 1,379,056 |
| Market Value (£) | 24,321,393 |
| % of Net Assets | 1.10% |
| Massmart | |
| Shares | 2,499,447 |
| Market Value (£) | 20,242,379 |
| % of Net Assets | 0.90% |
| MCB Bank | |
| Shares | 27,059,261 |
| Market Value (£) | 46,544,696 |
| % of Net Assets | 2.20% |
| MercadoLibre | |
| Shares | 25,100 |
| Market Value (£) | 4,235,813 |
| % of Net Assets | 0.20% |
| MGM China | |
| Shares | 7,364,800 |
| Market Value (£) | 12,221,062 |
| % of Net Assets | 0.60% |
| Moneta Money Bank | |
| Shares | 3,177,780 |
| Market Value (£) | 8,572,047 |
| % of Net Assets | 0.40% |
| MTN Group | |
| Shares | 491,665 |
| Market Value (£) | 3,567,511 |
| % of Net Assets | 0.20% |
| NagaCorp | |
| Shares | 28,988,000 |
| Market Value (£) | 13,186,471 |
| % of Net Assets | 0.60% |
| Naspers, N | |
| Shares | 670,079 |
| Market Value (£) | 92,259,945 |
| % of Net Assets | 4.30% |
| Nemak | |
| Shares | 13,283,252 |
| Market Value (£) | 11,781,900 |
| % of Net Assets | 0.50% |
| NetEase, ADR | |
| Shares | 107,104 |
| Market Value (£) | 24,273,829 |
| % of Net Assets | 1.10% |
| Nigerian Breweries | |
| Shares | 1,646,912 |
| Market Value (£) | 529,363 |
| % of Net Assets | 0.00% |
| Norilsk Nickel, ADR | |
| Shares | 1,115,800 |
| Market Value (£) | 13,993,134 |
| % of Net Assets | 0.70% |
| Pegatron | |
| Shares | 7,342,700 |
| Market Value (£) | 17,307,407 |
| % of Net Assets | 0.80% |
| Perusahaan Gas Negara Persero | |
| Shares | 51,093,100 |
| Market Value (£) | 7,710,695 |
| % of Net Assets | 0.40% |
| Ping An Insurance Group | |
| Shares | 6,207,316 |
| Market Value (£) | 26,612,364 |
| % of Net Assets | 1.30% |
| PTT Exploration and Production | |
| Shares | 4,658,157 |
| Market Value (£) | 10,064,324 |
| % of Net Assets | 0.50% |
| Reliance Industries | |
| Shares | 962,727 |
| Market Value (£) | 15,641,517 |
| % of Net Assets | 0.80% |
| SABIC, Participatory Note | |
| Shares | 1,286,754 |
| Market Value (£) | 26,491,154 |
| % of Net Assets | 1.20% |
| Samsung Electronics | |
| Shares | 100,060 |
| Market Value (£) | 147,198,766 |
| % of Net Assets | 6.90% |
| Savola Group, Participatory Note | |
| Shares | 198,128 |
| Market Value (£) | 1,736,984 |
| % of Net Assets | 0.10% |
| Sberbank Of Russia, ADR | |
| Shares | 3,145,645 |
| Market Value (£) | 28,968,752 |
| % of Net Assets | 1.30% |
| Security Bank | |
| Shares | 1,478,160 |
| Market Value (£) | 4,733,028 |
| % of Net Assets | 0.20% |
| Siam Commercial Bank | |
| Shares | 4,761,194 |
| Market Value (£) | 17,974,498 |
| % of Net Assets | 0.80% |
| SK Innovation | |
| Shares | 91,196 |
| Market Value (£) | 10,843,425 |
| % of Net Assets | 0.50% |
| Sunny Optical Technology | |
| Shares | 1,948,000 |
| Market Value (£) | 11,341,712 |
| % of Net Assets | 0.50% |
| Taiwan Semiconductor Manufacturing | |
| Shares | 19,212,000 |
| Market Value (£) | 95,415,330 |
| % of Net Assets | 4.40% |
| Tata Chemicals | |
| Shares | 1,800,000 |
| Market Value (£) | 13,234,892 |
| % of Net Assets | 0.60% |
| Tata Motors | |
| Shares | 3,250,509 |
| Market Value (£) | 11,248,153 |
| % of Net Assets | 0.50% |
| Tencent | |
| Shares | 3,211,400 |
| Market Value (£) | 73,471,044 |
| % of Net Assets | 3.40% |
| Thai Beverages | |
| Shares | 47,405,100 |
| Market Value (£) | 25,291,404 |
| % of Net Assets | 1.20% |
| TMK, GDR | |
| Shares | 1,611,441 |
| Market Value (£) | 6,815,607 |
| % of Net Assets | 0.30% |
| TOTVS | |
| Shares | 2,366,500 |
| Market Value (£) | 16,722,511 |
| % of Net Assets | 0.80% |
| Unilever | |
| Shares | 2,007,044 |
| Market Value (£) | 79,067,498 |
| % of Net Assets | 3.70% |
| Uni-President China | |
| Shares | 28,197,000 |
| Market Value (£) | 15,722,057 |
| % of Net Assets | 0.80% |
| United Bank | |
| Shares | 1,936,000 |
| Market Value (£) | 3,374,323 |
| % of Net Assets | 0.20% |
| Univanich Palm Oil | |
| Shares | 19,407,900 |
| Market Value (£) | 3,201,286 |
| % of Net Assets | 0.10% |
| Weifu High-Technology, B | |
| Shares | 1,766,014 |
| Market Value (£) | 3,209,771 |
| % of Net Assets | 0.10% |
| Yandex | |
| Shares | 1,141,109 |
| Market Value (£) | 19,970,090 |
| % of Net Assets | 0.90% |
| Youngone | |
| Shares | 288,540 |
| Market Value (£) | 6,830,713 |
| % of Net Assets | 0.30% |
Standard Life posted it final sets of figures before it merges with Aberdeen Asset Management
https://www.standardlife.com/dotcom/investor-information/financial-results.page
Salient Facts:
Assets under administration (AUA) increased by 1% to £361.9bn
Fee based revenue up 5% to £836m
Interim dividend per share up 8.2% to 7.00p
Standard Life is the pension provider for BT’s employees who joined after 2001, the BT Retirement Savings Scheme.
BT, the world’s most dynamic media and telecommunications corporation.
On Friday 4th August, Vodafone PLC paid out its 2017 half year dividend.
It was 8.95p a share (€0.1003 a share)
http://www.vodafone.com/content/index/investors/shareholders/ordinary_shareholders/dividends.html
What did this cost Vodafone plc ?
The total number of voting rights in Vodafone is 26,667,760,581
That means:-
26,667,760,581 x 8.95p a share = £2,386,764,572
That is £2.386 Billion
http://www.shareshop.hsbc.co.uk/shareshop/security.cgi?csi=10097
5.9% yield.
The JPMorgan Asian Investment Trust is a £320m London Listed Investment trust.
Top Ten Holdings:
Samsung Electronics 7.6%
Tencent 6.9%
AIA 5.8%
Alibaba 5.2%
Ping An Insurance 3.8%
HDFC Bank 3.2%
Kasikornbank 2.6%
CNOOC 2.6%
CK Hutchison 2.6%
Taiwan Semiconductor 2.4%
http://www.shareshop.hsbc.co.uk/shareshop/security.cgi?csi=50971
The The ETFS ISE Cyber Security Go ETF is an London Listed “Exchange Traded Fund” that invests in Cyber Security companies.
Its holdings are:-
SPLUNK INC USD 0.001
VERINT SYSTEMS INC.
F5 NETWORKS INC NPV
AKAMAI TECHNOLOGIES INC
SOPHOS GROUP PLC 3P 144A
RADWARE LTD ILS 0.05
SCIENCE APPLICATIONS INT USD 0.0001
JUNIPER NETWORKS INC USD 0.00001
CHECK POINT SOFTWARE TECHN USD 0.01
PALO ALTO NETWORKS INC USD 0.0001
QUALYS INC USD 0.001
MIMECAST LTD
TREND MICRO INC/JAPAN NPV
LEIDOS HLDGS INC USD 0.0001
VERISIGN INC USD 0.001
GEMALTO NV EUR 1.0
PROOFPOINT INC USD 0.0001
FORTINET I USD 0.001
BAE SYSTEM ORD GBP0.025
BARRACUDA NETWORKS INC USD 0.001
BOOZ ALLEN HAMILTON HLDG C USD 0.01
CISCO SYS INC USD 0.001
IMPERVA INC USD 0.0001
FFRI INC NPV
MANTECH INTL CORP USD 0.01
RAPID7 INC USD 0.01
VASCO DATA COM USD0.001
VARONIS SYS INC USD 0.001
KEYW HLDG CORP USD 0.001
A10 NETWORKS INC USD 0.00001
CYBERARK SOFTWARE LTD ILS 0.01
GIGAMON INC USD 0.0001
ZIX CORP USD 0.01
CONTRA AVG TECHNOLOGIES NV RR USD NPV
FIREEYE INC USD 0.0001
SYMANTEC CORP USD 0.01
PRECISE BIOMETRICS AB
AHNLAB INC KRW 500.0
£241,378,509 of Assets: That is £241m
Another month, guess what, take a lucky guess, it is the same old story, HM Government, spends more money than it receives via taxes and duties. Another deficit month, thus to bridge the gap, needs to borrow on the bond market.
In July 2017, the HM Government had to borrow money to meet the difference between tax revenues and public sector expenditure. The term for this is The PSNCR: The Public Sector Net Cash Requirement.
There were “only” 4 auctions of Gilts (UK Government Bonds) by the UK Debt Management Office (http://www.dmo.gov.uk/) to raise cash for HM Treasury:-
25-Jul-2017 1½% Treasury Gilt 2047 £2,500.0000 Million
19-Jul-2017 0¾% Treasury Gilt 2023 £3,162.4980 Million
06-Jul-2017 1¼% Treasury Gilt 2027 £2,867.8060 Million
When you add the cash raised:-
∑(£2,500.0000 Million + £3,162.4980 Million + £2,867.8060 Million) = £8530.304 Million
£8530.304 Million = £8.530304 Billion
On another way of looking at it, is in the 31 days in July, HM Government borrowed:-
£275 million each day for the 31 days.
We are fortunate, while the global banking and financial markets still has the confidence in HM Government to buy the Gilts (Lend money to the UK), the budget deficit keeps rising. What is also alarming, is the dates these bond mature 2023, 2027 and 2047. All long term borrowings, we are mortgaging our futures, but at least “We Are In It Together….”
Vanguard of the USA has launched a very low cost plaform for investors to access the global Equity and Bond market.
One of the largest money managers in the world.
The funds:-
https://www.vanguardinvestor.co.uk/what-we-offer/all-products
Today, UK Mortgages PLC has paid out its quarterly dividend.
https://twentyfouram.com/en/funds/uk-mortgages-fund/
it is paying out 1.5p per share.
250,000,000 shares in circulation
Thus:
£0.015 x 250,000,000 = £3,750,000.00
That is £3.75m cash paid to shareholders
http://www.shareshop.hsbc.co.uk/shareshop/security.cgi?csi=41993839
A yield of 3.2%
The State Oil Fund of the Republic of Azerbaijan is the Sovereign Wealth Fund of Azerbaijan.
SOFAZ is the name.
It is all stems from 1995, when a consortium was organized, known as the Azerbaijan International Operating Company (AIOC). Originally AIOC was composed of eleven major international companies: BP (UK), Amoco (U.S.), LUKoil (Russia), Pennzoil, (now Devon of U.S.), UNOCAL (U.S.), Statoil (Norway), McDermott (U.S.), Ramco (Scotland), TPAO (Turkey), Delta Nimir (now Amerada Hess of U.S.), and SOCAR (Azerbaijan).
Since then Exxon, now ExxonMobil (U.S.); ITOCHU (Japan); and INPEX (Japan) have joined the consortium and McDermott, Ramco and LUKoil have sold their shares.
It is this massive investment that has created investment revenues for the State Oil Fund of the Republic of Azerbaijan to invest its profits.
SOFAZ’s currency assets in the beginning of 2017 $33, 147 Million = $33 Billion
78.9% Fixed income and money market instruments
12.9% Equities
4.6% Real Estate
3.6% Gold.
It owns 78 St James Street, in London.
Guess who is the tenant ?
http://www.scagliolaco.com/project12.php
HSBC. A tenant that will pay the rent on time.
The Edinburgh Investment Trust plc is a London Listed FTSE-250 Investmen Company, managed by Invesco Perpertual.
It’s top 10 holdings are:
Reynolds 6.6%
British American Tobacco 5.5%
BP 4.4%
AstraZeneca 3.7%
Imperial Brands 3.7%
Provident Financial 3.6%
BAE Systems 3.6%
Altria – US common stock 3.6%
Legal & General 3.2%
Roche – Swiss common stock 3.1%
41.0% of the top 10 holdings
Portfolio breakdown % portfolio
FTSE 100 50.5%
FTSE 250 ex Inv Companies 23.4%
International Equities 15.2%
FTSE Small Cap Fledgling AIM ex Inv Companies 6.0%
Other Split Cap & Inv Companies 4.4%
Cash & Cash Equivalent 0.5%
Total 100.0%
A yield of 3.4%
The Custodian REIT plc is a UK London Listed Property Investment Company.
The Company’s investment objective is to provide Shareholders with an attractive level of income together with the potential for capital growth from investing in a diversified portfolio of commercial real estate properties in the UK.
130 property assets with a nationwide portfolio.
Portfolio value of £383.5m
Properties split across various real estate usage:
44% Industrial
16% Retail
15% Office
11% Retail Warehouse
14% Other: (Hotel, Restaurant, Trade Counter, Nursery, Motor Trade)
http://www.shareshop.hsbc.co.uk/shareshop/security.cgi?csi=27772757
A yield of over 5%
Today 3i (Investors in Industry) paid out its dividend to its shareholders.
18.5p per share.
What is the cost of this dividend to 3i PLC ?
http://otp.investis.com/clients/uk/3i_group_plc/rns/regulatory-story.aspx?cid=39&newsid=887837
3i Group plc has 972,826,882 issued ordinary shares, thus:-
972,826,882 x £0.185 = £179,972,973.17
That is £179 Million.
2.9% yield.

The peer to peer lender AssetzCapital have launched The Property Secured Investment Account
The Property Secured Investment Account is a way to invest exclusively in property backed loans designed to help you spread your risk across a broad range of autodiversified loans.
https://www.assetzcapital.co.uk/our-investment-accounts/property-account/
Here is how it works:-
https://player.vimeo.com/video/220451960?title=0&byline=0&portrait=0
A yield of 5.5% backed by a provision fund. Delicious.
Yesterday, Marks and Spencer the UK flagship high street retailer paid out its July Dividend.
11.9p per share.
What is the cost of this dividend to Marks and Spencer PLC ?
http://otp.investis.com/generic/regulatory-story.aspx?newsid=888055&cid=228
The Company’s capital consists of 1,624,731,648 ordinary shares with voting rights.
Thus:-
1,624,731,648 x £0.119 = £193,343,066.11
That is £193 Million.
http://www.shareshop.hsbc.co.uk/shareshop/security.cgi?csi=10057
2.4% yield.
Today, the UK’s largest Pharma company, GlaxoSmithKline paid out is July dividend.
19p per share.
What did this cost GlaxoSmithKline ?
The total number of voting rights in the Company is 4,918,418,059, thus:-
4,918,418,059, x £0.19 = £934,499,431.21
That is £934 million.
http://www.shareshop.hsbc.co.uk/shareshop/security.cgi?csi=10042
That is a 5% yield.
On the 5th July, The Hong Kong and Shanghai Banking Corporation paid out its quarterly dividend.
It is 7.8636 pence per share.
http://www.hsbc.com/investor-relations/share-and-dividend-information/dividend-timetable
The total number of voting rights in HSBC Holdings plc is 20,050,550,509.
Thus:-
20,050,550,509 x £0.078636 = £1,576,695,089.83
That is £1,576 Million = £1.576 Billion.
5.5% yield. Delicious
Another month, guess what, take a lucky guess, it is the same old story, HM Government, spends more money than it receives via taxes and duties. Another deficit month, thus to bridge the gap, needs to borrow on the bond market.
In June 2017, the HM Government had to borrow money to meet the difference between tax revenues and public sector expenditure. The term for this is The PSNCR: The Public Sector Net Cash Requirement.
There were “only” 4 auctions of Gilts (UK Government Bonds) by the UK Debt Management Office (http://www.dmo.gov.uk/) to raise cash for HM Treasury:-
27-Jun-2017 0 1/8% Index-linked Treasury Gilt 2026 £1,000.0000 Million
22-Jun-2017 1½% Treasury Gilt 2047 £2,587.4980 Million
06-Jun-2017 0½% Treasury Gilt 2022 £2,874.9990 Million
01-Jun-2017 1¼% Treasury Gilt 2027 £2,500.0000 Million
When you add the cash raised:-
∑(£1,000.0000 Million + £2,587.4980 Million + £2,874.9990 Million + £2,500.0000 Million) = £8962.497 Million
Million
£8962.497 Million = £8.962497 Billion
On another way of looking at it, is in the 30 days in June, HM Government borrowed:-
£298 million each day for the 30 days.
We are fortunate, while the global banking and financial markets still has the confidence in HM Government to buy the Gilts (Lend money to the UK), the budget deficit keeps rising. What is also alarming, is the dates these bond mature 2022, 2026, 2027 and 2037. All long term borrowings, we are mortgaging our futures, but at least “We Are In It Together….”
 The Intelligent Investors
On Monday 3rd July, The Scottish Mortgage Investment Trust paid out its dividend.
1.16p a share.
https://www.bailliegifford.com/individual-investors/funds/scottish-mortgage-investment-trust/
How much will this dividend cost ?
The total number of voting rights in Scottish Mortgage Investment Trust PLC is 1,367,519,485.
http://www.londonstockexchange.com/exchange/news/market-news/market-news-detail/SMT/13211234.html
Thus:
1,367,519,485 x £0.0161 = £22,017,063.71
That is £22m.
The USA’s Central Bank is the Federal Reserve.
https://www.federalreserve.gov/
Run by the New Yorker, Janet Yellan
https://en.wikipedia.org/wiki/Janet_Yellen
The Growth in the Federal Reserve’s balance sheet since 2007 when the Global Financial Crisis began is best documented here:-
https://www.federalreserve.gov/monetarypolicy/bst_recenttrends.htm
Total assets today are at over $4,470 Billion (That is $4.470 TRILLION).
Looking at that graph:
10th Sept 2007: Assets = $886,314 MILLION
22nd May 2017: Assets = $4,470,852 MILLION
One can see the US Fed buying the bad assets of the troubled banks = TARP The Troubled Asset Relief Programme.
The Invesco Perpetual UK Smaller Companies Investment Trust is a London Listed Invesment Company
A £640m fund.
Top 10 holdings:-
CVS 2.89%
FDM 2.49%
JD Sports Fashion 2.34%
Keywords 2.26%
JSG 2.21%
Dechra Pharmaceuticals 2.16%
Sanne 2.11%
Coats 2.09%
BooHoo 1.98%
Clinigen 1.93%
Total top 10 holdings make up 22.46 % of the total holdings.
The total number of holdings are 83.
http://www.shareshop.hsbc.co.uk/shareshop/security.cgi?csi=50965
A yield of over 3%
Zopa (Zone of Potential Agreement), the Peer to Peer lender has launched the Zopa ISA
http://www.zopa.com/lending/isa
the potential yield of over 6% is making the headlines.
http://www.telegraph.co.uk/investing/news/zopa-scraps-key-saver-protection-offers-isas-paying-61pc/
Yesterday Royal Dutch Shell paid out its Quarterly Dividend.
$0.47 a share is to be paid out.
$0.47 a share = 37.12p
Royal Dutch Shell plc’s capital consists of 4,476,695,491 A shares and 3,745,486,731 B shares, each with equal voting rights
https://irssl.euroinvestor.com/asp/ir/IRM_Shell/ssl2017/NewsRead.aspx?storyid=13615958&ishtml=1
Thus:-
4,476,695,491 A shares x 37.12p + 3,745,486,731 B shares x 37.12p = £3,052,074,040.81
That is £3 Billion.
Delicious.
The term last time buyers is the fact of the UK housing shortage.
The facts.
The housing market in the UK is stagnant, largely because there aren’t enough new houses being built for people to move into. With over 11.4 million homeowners over the age of 55 classed as Last Time Buyers.
These “Last Time Buyers” (LTBs) are sitting on £820 billion of property wealth and 7.7 million spare bedrooms. The equivalent to 2.6 million family homes.
Imagine the possibility of freeing up these houses ?
What huge affect this would have. So why has nothing happened ?
First, many older homeowners allow inertia to keep them in their current home, which is often no longer fit for purpose and expensive to maintain. Also, many of those 55 and over – and 63% of those with at least two spare bedrooms – do intend to move, but all too often, they leave it late. More than half believe that it will be best to wait until they are over 70 before moving, and a quarter will wait until 80. Coupled with a lack of suitable alternatives, high asking prices and the potential tax burden when they do try to downsize, this means that many will never make the move.
We need tax advantages to help our retired population down size and free up homes and nlock huge amounts of wealth.
BP today paid out its quarterly dividend, Fri 23rd June 2017
http://otp.investis.com/clients/uk/bp_plc/rns/regulatory-story.aspx?cid=233&newsid=881611
the first quarter 2017 would be US$0.10 per ordinary share = 7.7563 pence per share.
What is the cost of this dividend to BP PLC ?
http://otp.investis.com/clients/uk/bp_plc/rns/regulatory-story.aspx?cid=233&newsid=878650
The total number of voting rights in BP p.l.c. is 19,684,630,913
Thus:
19,684,630,913 x 7.7563 pence per share = £1,526,799,027.51
That is £1.526 Billion = £1.526 Billion
A yield of 6.9%. Delicious.
The Henderson Diversified Income Trust is a London Listed investment company
https://www.janushenderson.com/ukpi/fund/195/henderson-diversified-income-limited
The Top Ten Holdings are:-
1 VIRGIN MEDIA SECURED FINANCE PLC 6.25% BDS 28/03/29 GBP100000REG S 2.10%
2 NATIONWIDE BLDG SOC 10.25% VAR PERP CCDS GBP 2.00%
3 CO-OPERATIVE GROUP HLDGS 2011 LTD 6.25% NTS 08/07/26 GBP100000 1.80%
4 CSC 6.625% 2025 1.80%
5 PGH CAPITAL 6.625% 18/12/25 1.80%
6 TRAVELPORT 6/16 TLB 1.80%
7 COTT CORP 5.5% BDS 01/04/25 USD2000 144A 1.70%
8 CREDIT SUISSE GROUP 6.25% 2049 1.70%
9 ERICOM IRELAND 10/16 TLB 1.60%
10 EVRY 9/10 TLB4 1.60%
http://www.shareshop.hsbc.co.uk/shareshop/security.cgi?csi=250708&action=
a yield of over 5%
Work done by highly regarding Resolution Foundation shows how living standards are falling
http://www.resolutionfoundation.org/
As inflation picks up, and wage growth is near zero, our purchasing power falls.
As items such as petrol for the car, food such as staples like bread, milk, cheese and fruit all increase in price, but zero wage growth, life gets hard.
What this shows time and time again, the most vulnerable suffer.

Climbed from 105p to today at 250p.
The Real Estate Credit Investments focuses on secured commercial and residential debt in the UK and Western Europe by exploiting opportunities in publically traded securities and real estate loans.
http://www.recreditinvest.com/
The Investment Portfolio of loans is worth £163.7m
Number of loans 19
Fair Value £112.8m of loans
Number of bonds 28
Bond Portfolio £62.7m
http://www.shareshop.hsbc.co.uk/shareshop/security.cgi?csi=152828&action=
The Alcentra European Floating Rate Income Fund Limited is London listed investment company.
The fund invests predominantly in senior secured loans and floating rate senior secured bonds issued by European corporates.
5 Largest Holdings:-
Numericable 3.14% of Fund
Motor Fuel Group 2.57% of Fund
ERM 2.46% of Fund
Diaverum 2.20% of Fund
Cabot 1.95% of Fund
The Geographic Breakdown:-
UK 34.62%
France 16.02%
Netherlands 10.61%
Germany 8.78%
USA 6.34%
Luxembourg 5.09%
Sweden 4.47%
Spain 3.49%
Norway 2.62%
Other 5.99%
Cash 1.97%
It pays dividends monthly.
http://www.shareshop.hsbc.co.uk/shareshop/security.cgi?csi=2673632
A yield of over 6.5%
On Thursday 8th June, Legal and General PLC paid out 10.35p to shareholders.
What was the cost of the dividend to Legal and General PLC ?
http://ir.euroinvestor.com/Tools/newsArticleHTML.aspx?solutionID=3066&customerKey=legalandgeneralgroup&storyID=13617595&language=en
The Company’s capital consisted of 5,955,353,619 Ordinary shares of 2.5p each, with voting rights.
Thus:-
5,955,353,619 x £0.1035 = £616,379,099.57
That is £616 Million
http://www.shareshop.hsbc.co.uk/shareshop/security.cgi?csi=10055&action=
that is 5.5% yield.
Delicious.
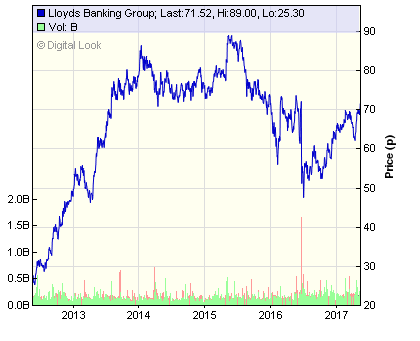
The Lloyds Banking Group has now finally returned to private ownership after the 2008 financial crisis.
Today the shares offer a dividend yield of over 3.5%
http://www.shareshop.hsbc.co.uk/shareshop/security.cgi?csi=10056&action=
Look at the 5 year performance.
Lows of 30p
Highs of 88p
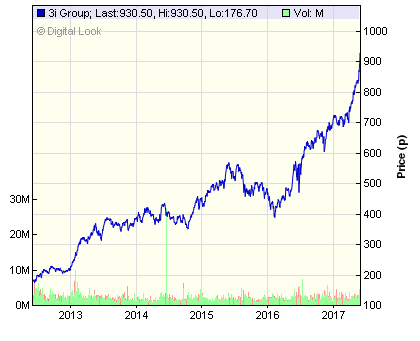
3i: Investors In Industry.
Its share price growth over the past 5 years in amazing
from £2 to £9.
Another month, guess what, take a lucky guess, it is the same old story, HM Government, spends more money than it receives via taxes and duties. Another deficit month, thus to bridge the gap, needs to borrow on the bond market.
In May 2017, the HM Government had to borrow money to meet the difference between tax revenues and public sector expenditure. The term for this is The PSNCR: The Public Sector Net Cash Requirement.
There were “only” 3 auctions of Gilts (UK Government Bonds) by the UK Debt Management Office (http://www.dmo.gov.uk/) to raise cash for HM Treasury:-
23-May-2017 0 1/8% Index-linked Treasury Gilt 2036 £882.3000 Million
18-May-2017 1¾% Treasury Gilt 2019 £2,962.1500 Million
04-May-2017 1¾% Treasury Gilt 2037 £2,293.7880 Million
When you add the cash raised:-
∑(£882.3000 Million + £2,962.1500 Million + £2,293.7880 Million) = £6,138.238 Million
£6,138.238 Million = £6.138238 Billion
On another way of looking at it, is in the 31 days in May, HM Government borrowed:-
£198 million each day for the 31 days.
We are fortunate, while the global banking and financial markets still has the confidence in HM Government to buy the Gilts (Lend money to the UK), the budget deficit keeps rising. What is also alarming, is the dates these bond mature 2019, 20236and 2037. All long term borrowings, we are mortgaging our futures, but at least “We Are In It Together….”
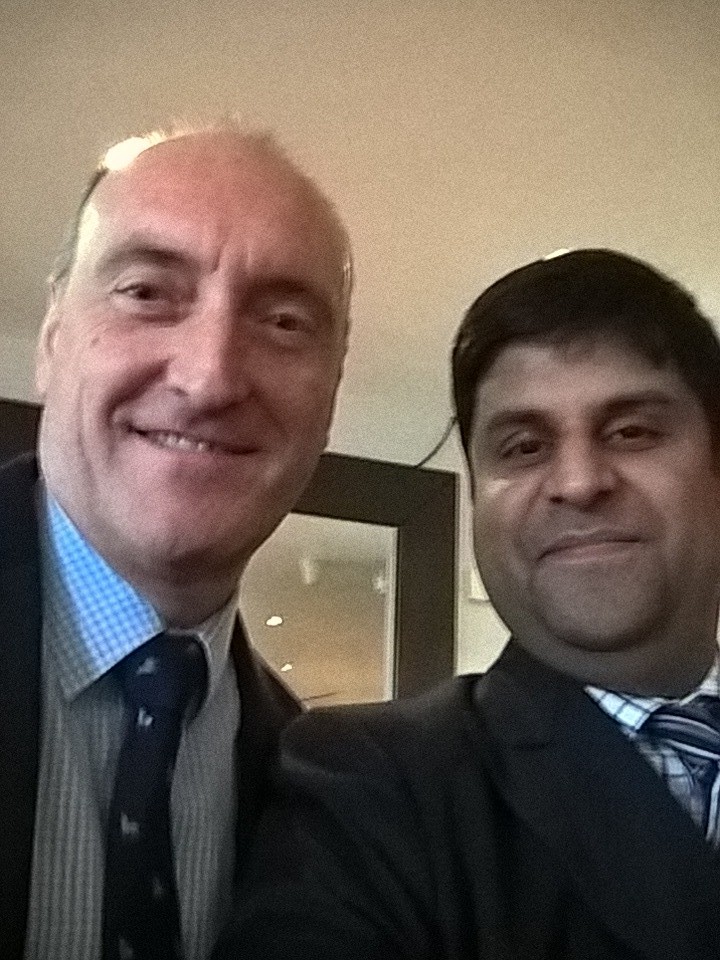
Luis Alvarez the former CEO of BT Global Services with www.asadkarim.co.uk
In these near zero interest rate times (base rate in 0.25%), the hunt for yield is imperative.
However, one can find some gold nuggets if one looks hard.
http://www.greencoat-ukwind.com/
An infrastructure investor in UK wind farms. Twenty wind farms comprising a net capacity of 436.1MW
http://www.shareshop.hsbc.co.uk/shareshop/security.cgi?csi=7013076&action=
A yield of over 5%
The BlackRock Commodities Income Investment Trust plc is a London listed investment vehicle
It’s top ten holdings are:-
1. Royal Dutch Shell Plc B. 6.6%
2. First Quantum Minerals Ltd. 6.0%
3. Rio Tinto Plc. 5.7%
4. Exxon Mobil Corporation 5.5%
5. BHP Billiton Plc. 3.7%
6. MMC Norilsk Nickel 2.9%
7. Newcrest Mining Ltd. 2.8%
8. Enbridge Income Fund Holdings Inc. 2.7%
9. Conocophillips. 2.7%
10. Glencore International PLC. 2.6%
Total of 41.2%
http://www.shareshop.hsbc.co.uk/shareshop/security.cgi?csi=152827&action=
A yield of over 8%
The Best PM the UK Never Had.
The insurance fund consolidating company Phoenix Holdings has an incredible dividend policy.
http://www.thephoenixgroup.com/
it is over 6%.
In an environment of 0.25% Base Rate, this yield is delicious.
The UK’s Flagship Index is the FTSE-100 Index.
The symbol is UKX
http://www.shareshop.hsbc.co.uk/shareshop/security.cgi?csi=50058
The top 100 UK companies but 12 companies distort the index due to relative weightings.
Royal Dutch Shell is 9.2% of the FTSE-100
HSBC 6.9% of the FTSE-100
British American Tobacco 5.4% of the FTSE-100
BP 4.7% of the FTSE-100
GlaxoSmithKline 4.2% of the FTSE-100
AstraZeneca 3.2% of the FTSE-100
Diageo 3.1% of the FTSE-100
Vodafone 2.9% of the FTSE-100
Unilever 2.6% of the FTSE-100
Reckitt Benckiser 2.5% of the FTSE-100
Lloyds Banking Group 2.4% of the FTSE-100
Prudential 2.4% of the FTSE-100
That is 12 companies make up 49.5% of the whole index.
What does this mean ?
So if you invested £1,000 with a FTSE 100 tracker, 49.5% of that £1,000 which is nearly half of your investment just goes into 12 stocks. That means, £495 of your cash is invested in the 12 companies above, and then the remaining £505 will be spread between 88 companies.
Thus your fortunes are tied to really 12 companies and their performance. A very distorted index.
On Friday 19th May 2017, The Prudential paid its 30.57p dividend to shareholders
with assets of £599 Billion Under Management.
The total number of voting rights in Prudential is therefore 2,585,706,972
http://otp.investis.com/clients/uk/prudential_plc/rns/regulatory-story.aspx?cid=401&newsid=868325
Thus:
2,585,706,972 * £0.3057 = £790,450,621.34
That is £790 million
2.5% yield
On Wednesday 17th May 2017, GKN paid its 5.9p dividend to shareholders
Founded in 1759 with today over 58,000 employees, GKN is a global engineering business. GKN, design, manufacture and service systems and components for most of the world’s leading aircraft, vehicle and machinery manufacturers.
Founded more than 250 years ago, GKN have adapted, developed and grown into a £9.4 billion business at the forefront of global technology
The total number of voting rights in GKN plc is 1,717,311,053
http://otp.investis.com/clients/uk/gkn1/rns/regulatory-story.aspx?cid=76&newsid=868483
Thus:
1,717,311,053 * £0.059 = £101,321,352.13
That is £101 million
http://www.shareshop.hsbc.co.uk/shareshop/security.cgi?csi=10041
2.5% yield
Yesterday, (Tue 16th May), Lloyds Banking Group, paid out its dividend to shareholders.
2.2p was paid out.
What did this 2.2p dividend cost Lloyds Banking Group ?
The share capital of Lloyds Banking Group is made up of 71,459,965,313 ordinary shares
Thus:
71,459,965,313 x £0.022 = £1,572,119,236.89
That is £1.572 Billion of cash
http://www.shareshop.hsbc.co.uk/shareshop/security.cgi?csi=10056&action=
A yield of over 3%
The UK’s national electricity network is owned and run by National Grid.
HM Opposition (the Labour party) are proposing it is nationalised if they win the UK general election.
What would it cost for the UK Government to buy back National Grid from the investors who own it today ?
Share Price is about £10 a share.
Total voting rights
http://otp.investis.com/clients/uk/national_grid/rns/regulatory-story.aspx?cid=374&newsid=868275
3,753,238,483 are the shares in circulation
Thus:
3,753,238,483 x £10 = £37,532,384,830
That is £37 Billion pounds which is just about the UK’s current annual defence budget.
Also, if the UK Government bought National Grid, it has to take on it’s debt.
That debt is over £25bn.
So, potentially spends £37bn to buy it and needs to cover the £25bn of debt.
On Thursday 11th May, BT plc, the worlds most dynamic media and telecoms group announced its annual results.
http://otp.investis.com/clients/uk/bt/rns/regulatory-story.aspx?cid=1470&newsid=870893
The proposed dividend is delicious:
“Proposed final dividend of 10.55p, up 10%, giving a full year dividend of 15.40p, also up 10%.”
Now the total voting rights are
http://otp.investis.com/clients/uk/bt/rns/regulatory-story.aspx?cid=1470&newsid=867698
The total number of voting rights in BT Group plc on that date was 9,960,490,519
This, the dividend will cost BT:
9,960,490,519 x £0.1055 = £1,050,831,750
That is just over £1 Billion.
a 5% yield. Delicious
Apple has massive cash reserves.
The figures are incredible.
https://www.apple.com/newsroom/pdfs/Q2FY17ConsolidatedFinancialStatements.pdf
The Balance Sheet is revealing:-
Current assets:
Cash and cash equivalents $15,157,000,000
Short-term marketable securities $51,944,000,000
Accounts receivable, less an allowance of $53 at each period end 11,579,000,000
Inventories $2,910,000,000
Vendor non-trade receivables $9,033,000,000
Other current assets $11,367,000,000
Total current assets $101,990,000,000
Long-term marketable securities $189,740,000,000
Property, plant and equipment, net $27,163,000,000
Goodwill $5,473,000,000
Acquired intangible assets, net $2,617,000,000
Other non-current assets $7,549,000,000
Total assets $ 334,532,000,000
It holds over $15 Billion in cash or close to cash assets such as T-Bills
It holds $51 Billion in short term securities, such as 3 Month T-Bills or Asset Back Commercial Paper that matures in 3 months
It holds inventory (iPads, iPhones) worth $2.9 Billion
It holds long term assets such as Bonds and other financial instruments of $189 Billion
So the financial assets are $15bn + $51bn + $189bn. = BIG MONEY = $255bn
Infrastructure India PLC is an AIM London listed company buying infrastructure assets in India.
It currently owns 4 assets in India:
Distribution Logistics Infrastructure Limited (DLI)
Shree Maheshwar Hydel Power Corporation Limited
Indian Energy Limited (IEL)
India Hydropower Development Company, LLC
The Foreign & Colonial Property Trust has had amazing performance.
http://www.shareshop.hsbc.co.uk/shareshop/security.cgi?csi=112535
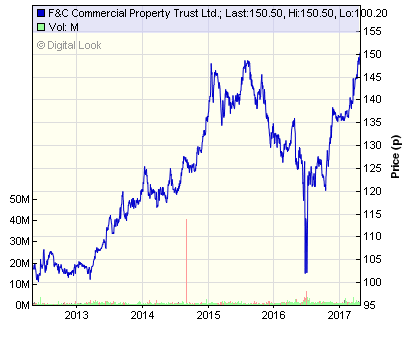
A yield of 4%
Look at the growth and the clear dip of Brexit, and then recovery.
Another month, guess what, take a lucky guess, it is the same old story, HM Government, spends more money than it receives via taxes and duties. Another deficit month, thus to bridge the gap, needs to borrow on the bond market.
In April 2017, the HM Government had to borrow money to meet the difference between tax revenues and public sector expenditure. The term for this is The PSNCR: The Public Sector Net Cash Requirement.
There were “only” 4 auctions of Gilts (UK Government Bonds) by the UK Debt Management Office (http://www.dmo.gov.uk/) to raise cash for HM Treasury:-
26-Apr-2017 0 1/8% Index-linked Treasury Gilt 2046 £857.7930 Million
20-Apr-2017 0½% Treasury Gilt 2022 £3,162.4970 Million
12-Apr-2017 2½% Treasury Gilt 2065 £1,724.9990 Million
04-Apr-2017 1¼% Treasury Gilt 2027 £2,867.7390 Million
When you add the cash raised:-
∑(£857.7930 Million + £3,162.4970 Million + £1,724.9990 Million + £2,867.7390 Million = £8,613.028 Million
£8,613.028 Million = £8.613028 Billion
On another way of looking at it, is in the 30 days in April, HM Government borrowed:-
£287 million each day for the 30 days.
We are fortunate, while the global banking and financial markets still has the confidence in HM Government to buy the Gilts (Lend money to the UK), the budget deficit keeps rising. What is also alarming, is the dates these bond mature 2022, 2027 2046 and 2065. All long term borrowings, we are mortgaging our futures, but at least “We are in it together…”
Yesterday (Tue 2nd May), the Foreign & Colonial Investment Trust paid out it’s monthly dividend of 2.7p to shareholders.
http://www.fandc.com/foreign-and-colonial-investment-trust/
Companies % of Portfolio
Amazon 1.4
UnitedHealth 1.2
Alphabet 1.1
Microsoft 1.1
Utilico Emerging Markets 0.9
Facebook 0.8
BP 0.8
Priceline 0.8
Philip Morris 0.7
Apple 0.7
Total assets: £3.6 billion
http://otp.investis.com/clients/uk/fandc/rns/regulatory-story.aspx?cid=521&newsid=860565
The total number of voting rights that can be exercised in the Company is: 545,024,660
Thus:
545,024,660 x £0.027 = £14,715,665.82
That is £14m in dividend payments
http://www.shareshop.hsbc.co.uk/shareshop/security.cgi?csi=10192&action=
A yield of 1.7%
Dow 30 Index
The Dow Jones is now hitting all times highs. Who are the Dow 30 Companies
MMM 3M
AXP American Express
AAPL Apple
BA Boeing
CAT Caterpillar
CVX Chevron
CSCO Cisco
KO Coca-Cola
DIS Disney
DD E I du Pont de Nemours and Co
XOM Exxon Mobil
GE General Electric
GS Goldman Sachs
HD Home Depot
IBM IBM
INTC Intel
JNJ Johnson & Johnson
JPM JPMorgan Chase
MCD McDonald’s
MRK Merck
MSFT Microsoft
NKE Nike
PFE Pfizer
PG Procter & Gamble
TRV Travelers Companies Inc
UTX United Technologies
UNH UnitedHealth
VZ Verizon
V Visa
WMT Wal-Mart
Yesterday (Friday 28th April), the TwentyFour Select Monthly Income Fund paid out it’s monthly dividend of 0.5p to shareholders.
https://twentyfouram.com/en/funds/twentyfour-select-monthly-income-fund/
Security Sector % of whole fund
NWIDE 10.25 PERP CCDS Banks 2.93
COVBS 6.375 PERP Banks 2.48
SANUK 10.375 Banks 2.34
AVOCA 11X F ABS 2.25
JUBIL 2014-12X F ABS 2.19
BRACKN 10.5 11/15/21 REGS High Yield – EU 1.98
ALDMRE 11.875 PERP Banks 1.89
ARGID 6.625 09/15/23 REGS High Yield – EU 1.85
CS 7.5 PERP REGS Banks 1.84
HPARK 1X E ABS 1.82
With 154.6 million shares in circulation: 154,600,000
Thus 154,600,000 x £0.005 = £773,000 was the cost of the dividend.
http://www.shareshop.hsbc.co.uk/shareshop/security.cgi?csi=26656574
A yield of 7%. You read that correct.
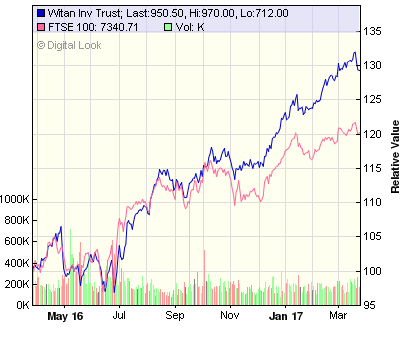
The Performance of The Witan Investment Trust.
The Witan Investment Trust is a long standing famous London listed Investment Trust.
The performance is amazing
Berkshire Hathaway the investment company run by Charlie Munger and Warren Buffet holds these stocks in its investment portfolio.
151,610,700 shares in American Express Company = 16.8% of Company Owned
61,242,652 shares in Apple Inc. 1.1% of Company Owned
6,789,054 shares in Charter Communications, Inc. 2.5% of Company Owned
400,000,000 shares in The Coca-Cola Company 9.3% of Company Owned
54,934,718 shares in Delta Airlines Inc. 7.5% of Company Owned
11,390,582 shares in The Goldman Sachs Group, Inc. 2.9% of Company Owned
81,232,303 shares in International Business Machines Corp. 8.5% of Company Owned
24,669,778 shares in Moody’s Corporation 12.9% of Company Owned
74,587,892 shares in Phillips 66 14.4% of Company Owned
22,169,930 shares in Sanofi 1.7% of Company Owned
43,203,775 shares in Southwest Airlines Co. 7.0% of Company Owned
101,859,335 shares in U.S. Bancorp 6.0% of Company Owned
26,620,184 shares in United Continental Holdings Inc. 8.4% of Company Owned
43,387,980 shares in USG Corp. 29.7% of Company Owned
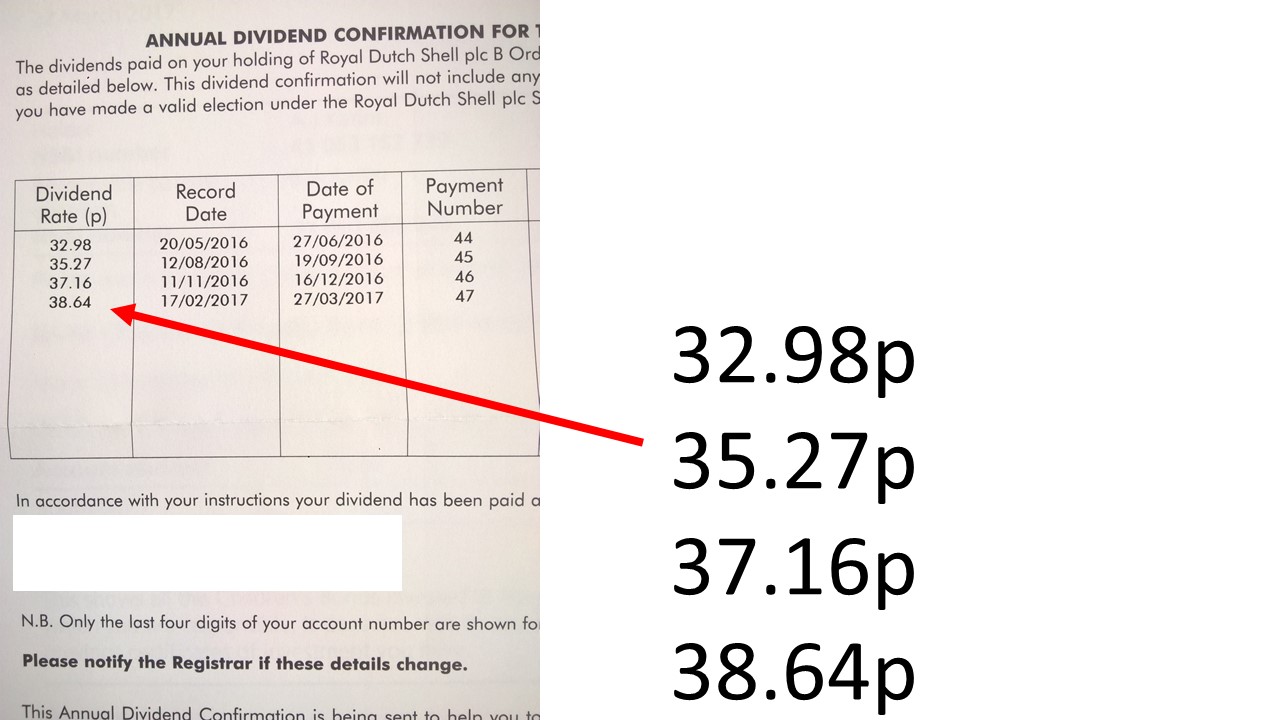
32.98p on 27/06/2016
35.27p on 19/09/2016
37.16p on 16/12/2016
38.64p on 27/03/2017
The Dividend has been fixed at US$0.47 yet you can see the dividend has increased quarter on quarter due to devaluation of £Sterling
Astra Zeneca PLC is one of the world’s largest Pharmaceutical companies.
It has a debt funding programme to help finance its operations
https://www.astrazeneca.com/investor-relations/debt-investors.html
15 sets of listed bonds that trade on the debt market.
Fx Amount(m) Issue Maturity Coupon
USD 1,750 12-Sept-07 15-Sept-17 5.90%
USD 1,000 16-Nov-15 16-Nov-18 1.75%
USD 400 16-Nov-15 16-Nov-18 3m Libor + 0.53%
USD 1,000 18-Sep-12 18-Sep-19 1.95%
USD 1,600 16-Nov-15 16-Nov-20 2.375%
EUR 500 12-May-16 12-May-21 0.25%
EUR 750 24-Nov-14 24-Nov-21 0.875%
USD 288 15-Nov-93 15-Nov-23 7.00%
EUR 900 12-May-16 12-May-24 0.75%
USD 2,000 16-Nov-15 16-Nov-25 3.375%
EUR 800 12-May-16 12-May-28 1.25%
GBP 350 13-Nov-07 13-Nov-31 5.75%
USD 2,750 12-Sep-07 15-Sep-37 6.45%
USD 1,000 18-Sep-12 18-Sep-42 4.00%
USD 1,000 16-Nov-15 16-Nov-45 4.375%
In total = $6,101 Million = £7,546 Million of debt.
The UK Government is spending more (National Government Expenditure) than it gets in income (Taxes, Duties, Asset Sales).
This document makes somber reading.
http://www.dmo.gov.uk/documentview.aspx?docname=remit/drmr1718.pdf&page=Remit/full_details
2018-19 needs £123.0 Billion of Borrowing
2019-20 needs £130.9Billion of Borrowing
2020-21 needs £136.3 Billion of Borrowing
2021-22 needs £116.4 Billion of Borrowing
Thus national debt increases by £505 Billion in the next 4 years.
Glencore is the FTSE-100 listed miner and commodities trader.
The performance of its shares in the past 12months is amazing.
http://www.shareshop.hsbc.co.uk/shareshop/security.cgi?csi=2558517
Shares have climbed from just over 100p to over 320p
That is over 300% gain in 12months,
Compare it against the FTSE100.
http://www.shareshop.hsbc.co.uk/shareshop/security.cgi?csi=50058
from 5800 points to just over 7300.
That is a gain over just over 25%


Today, GSK (GlaxoSmithKline) pays out its dividend to its shareholders.
23p a share.
What will that cost ?
The total number of voting rights in the Company is 4,917,299,936
Thus:
4,917,299,936 * £0.23 = £1,130,978,985.28
That is £1.13 Billion
http://www.shareshop.hsbc.co.uk/shareshop/security.cgi?csi=10042
a yield of over 4%
BT PLC is the worlds most dynamic telecommunications and media corporation in the world.
It has global operations had has a huge pension fund to pay the pensions of former employees.
The pensions portal for the pension fund is:-
Some very interesting statistics can be found here in its latest newsletter to members:-
http://www.btpensions.net/download/469/BTPS-Deferred+newsletter+2017.pdf
Today in 2016 it has 201,261 actual pensioners claiming a pension from the £43,168 Million fund
Annually the pension money paid out is £2,359 Million to the 201,261 pensioners.
One can do some simple calculations now:-
the average pension then paid out is £2,359 Million / 201,261 pensioners
That is £11721.09 a year which is £976.75 a month.
Just an average figure of what is paid out.
http://www.bbc.co.uk/news/uk-politics-39485083
Highwire by The Rolling Stones
We sell ’em missiles, We sell ’em tanks
We give ’em credit, You can call up the bank
It’s just a business, You can pay us in crude
You’ll love these toys, just go play out your feuds
We got no pride, don’t know whose boots to lick
We act so greedy, makes me sick sick sick
So get up, stand up, out of my way
I wanna talk to the boss right away
Get up, stand up, who’s gonna pay
I wanna talk to the man right away
We walk the highwire
Sending men to the front line
And hoping they don’t catch the hell-fire
Of hot guns and cold, cold lies
We walk the highwire
Send the men to the front lines
And tell ’em to hotbed the sunshine
With hot guns and cold, cold lies
Our lives are threatened, our jobs at risk
Sometimes dictators need a slap on the wrist
Another Munich we just can’t afford
We’re gonna send in the 82nd Airborne
Get up, stand up, who’s gonna pay
I wanna talk to the boss right away
Get up, stand up, outta my way
I wanna talk to the man right away
We walk the highwire
Putting the world out on a dead lie
And hoping they don’t taste the shell-fire
Of hot guns and cold, cold lies
We walk the highwire
Putting the world out on a dead lie
Catching the fight on the primetime
With hot guns and cold, cold lies
Get up! Stand up!
Dealer! Stealer!
Hey!
We walk the highwire
Sending men to the front line
And hoping that we backed the right side
With hot guns and cold, cold lies
We walk the highwire
Sending men to the front line
And hoping they don’t catch the hell-fire
With hot guns and cold, cold, cold, cold, cold lies
We walk the highwire
We walk the highwire
With hot guns and cold, cold, cold lies.
Another month, guess what, take a lucky guess, it is the same old story, HM Government, spends more money than it receives via taxes and duties. Another deficit month, thus to bridge the gap, needs to borrow on the bond market.
In March 2017, the HM Government had to borrow money to meet the difference between tax revenues and public sector expenditure. The term for this is The PSNCR: The Public Sector Net Cash Requirement.
There were “only” 5 auctions of Gilts (UK Government Bonds) by the UK Debt Management Office (http://www.dmo.gov.uk/) to raise cash for HM Treasury:-
02-Mar-2017 0½% Treasury Gilt 2022 £2,500.0000 Million
09-Mar-2017 0 1/8% Index-linked Treasury Gilt 2036 £833.7370 Million
14-Mar-2017 1¼% Treasury Gilt 2027 £2,557.9170 Million
22-Mar-2017 1½% Treasury Gilt 2047 £2,299.9970 Million
28-Mar-2017 0½% Treasury Gilt 2022 £2,874.9990 Million
When you add the cash raised:-
∑(£2,500.0000 Million + £833.7370 Million + £2,557.9170 Million + £2,299.9970 Million + £2,874.9990 Million = £11,066.65 Million
£11,066.65 Million = £11.06665 Billion
On another way of looking at it, is in the 31 days in March, HM Government borrowed:-
£356 million each day for the 31 days.
We are fortunate, while the global banking and financial markets still has the confidence in HM Government to buy the Gilts (Lend money to the UK), the budget deficit keeps rising. What is also alarming, is the dates these bond mature 2022, 2027 and 2047. All long term borrowings, we are mortgaging our futures, but at least “We are in it together…”
One of the most significant changes from the HM Government, 2017 Spring Budget is the reduction in the tax-free dividend allowance from £5,000 to £2,000. It affects investors who are shareholders with portfolios – of about more than £50,000, and what this means more people may have to pay more tax on their dividend income on the shares they own.
The change is effective from April 2018, meaning investors have just over a year to organise their dividend income to shield it as much as possible from increased tax charges. Potential options to consider.
(1). Using the tax-free dividend allowance
Investors will continue to have a £2,000 tax-free dividend allowance, which means they will be able to hold about £50,000 in stocks. Today, the FTSE-100 Index is yielding 3.8% (a rough approximation on dividend yield) before having to pay any tax on dividend income. Investors could decide on moving their highest-yielding stocks (BP, Vodafone, Shell etc etc ) into ISAs or Pensions, while keeping the lower-yielding stocks (growth stocks) outside the ISA wrapper.
(2). Using ISA’s
Investors could use ISA’s to shield their dividend income as they offer tax-free income and growth. By acting before the end of this tax year, investors can shield up to £55,240 in a stocks and shares Isa by the time the new allowance comes into force:
* £15,240 in 2016/17
* £20,000 in 2017/18
* £20,000 on first day of the tax year, 6 April 2018.
By using both of a couple’s allowances, this could mean investing up to £110,480 over three years.
If investors sell existing share holdings and reinvest the proceeds in an ISA using the ‘bed and ISA’ rules, this may give rise to a capital gains tax charge, although it could be partially or fully covered by the individual’s £11,100 (2016/17) capital gains tax exemption. Investors need to be aware that ISA’s, unlike direct share holdings, cannot be placed into trust for inheritance tax (IHT) planning. Instead, when the investor dies, the ISA will remain within the estate for the purposes of IHT. This is in sharp contrast with pension investments, which are usually deemed to be outside the estate.
(3). Switching investment objectives
For any shareholdings that cannot be shielded in ISA, investors could consider switching their investment profile – moving from an emphasis on generating income to one centred on capital appreciation. If investors decide to reduce their income-generating investments, they could also choose to regularly sell investments or gains to supplement their reduced dividend income.
While these actions may be helpful in reducing dividend income tax liability, they may store up future capital gains tax charges unless planning is undertaken to counter this.
Concluding comments from www.asadkarim.co.uk:
The tax rules for shareholders have been changing fast. The tax-free dividend allowance was only introduced a year ago, and now it is being more than halved.
These quick-fire changes send out a confused message to those trying to save for their futures, and makes it difficult to set a long-term plan. But it also flags up the need for shareholders to work with their advisers to make sure their investment portfolio is tax-efficient. Tax is not the only consideration when setting the right portfolio, but it is an important one.
Why investing in “productive assets” such as Real Estate or Stocks is more valuable in the long term compared to “commodity” such as Gold.
https://www.youtube.com/watch?v=uTj9HEt3Mc0
Hank Paulson (former US Treasury Secretary), interviewed by Warren Buffet.
The JP Morgan Indian Investment Trust has had an incredible run
20 years ago, it was about 70p, today it is over 680p.
5 years ago it was about 350p and today it is 683p.
http://www.shareshop.hsbc.co.uk/shareshop/security.cgi?csi=11885&action=
5 year graph:-
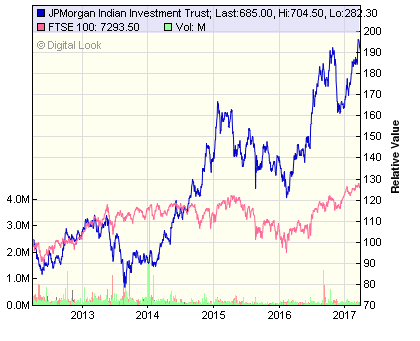
The news broke on Monday 27th March, that a new field of oil has been found.
http://www.bbc.co.uk/news/uk-scotland-north-east-orkney-shetland-39406131
Hurricane Oil has found a field in the North Sea of 1,000,000,000 barrels of oil.
http://www.hurricaneenergy.com/
They made the discovery of a huge new field:-
Now lets put that into context.
The world consumes 96 million barrels of oil.
https://www.iea.org/about/faqs/oil/
So Hurriane’s new field:
1,000,000,000 barrels of oil / 96 million barrels of oil a day = 10.4 days new supply of oil for the world.
The Manchester and London Investment Trust is a London Listed Investment Fund.
http://www.manchesterandlondon.co.uk/
The Investment Manager is M & L Capital Management Limited.
The Top Investments:-
Microsoft Corp
Amazon.com
Alphabet
Facebook
Apple
Polar Capital Technology Trust
GlaxoSmithKline
Scottish Mortgage Investment Trust
Smith & Nephew
Heineken
Yahoo
Shire
Worldwide Health Trust
Beiersdorf
Dadide Campari-Milano
Salesforce
Pernod Richard
Unilever
Zoetis
Paypal
Nvidia
Astra Zeneca
Roche Holdings
The SME Loan Fund
Syngenta
The Shareprice is £3.34 but the actual asset value is £4.08.
Thus a discount of 20%. What this means ?
Buying a £4.08 asset for £3.34.
The Bankers Investment Trust is a very old fund, founded in 1888, by the directors of Williams and Glyn Bank, which is a part of the Royal Bank of Scotland.
https://www.henderson.com/ukpi/fund/168/the-bankers-investment-trust-plc
Since 1966, the dividend has grown year on year.
The top ten holdings are:-
BP
British American Tobacco
Royal Dutch Shell
Apple
Comcast
Delphi Automotive
American Tower
Alphabet
American Express
Cooper Cos
The Trust is managed by Henderson Investors.
The largest shareholder:-
5.4% owned bt Investec Wealth & Investment
http://www.shareshop.hsbc.co.uk/shareshop/security.cgi?csi=10127&action=
a yield of 2.3%
Yesterday, AstraZeneca paid out this March 2017 Dividend.
The dividend was £1.502 a share
https://www.astrazeneca.com/investor-relations/dividend-policy.html
Now how much will that cost the company ?
As at 28 February 2017 the issued share capital of AstraZeneca PLC with voting rights is 1,265,386,327 ordinary shares of US$0.25. No shares are held in Treasury. Therefore, the total number of voting rights in AstraZeneca PLC is 1,265,386,327.
Thus:
1,265,386,327 * £1.502 a share = £1,900,610,263
That is £1.9 Billion of cash
That is a yield of 4.6%
£$€….That’s What I Want
https://www.youtube.com/watch?v=W25_jgiY51I
On December 2nd 2016, Shell PLC announced the quarterly dividend of US$0.47 per A ordinary share (“A Share”) and B ordinary share (“B Share”).
https://irssl.euroinvestor.com/asp/ir/IRM_Shell/ssl2017/NewsRead.aspx?storyid=13492555&ishtml=1
That $0.47 = 37.16p.
Now, three months on, on March 10th 2017, Shell announced the quarterly dividend of US$0.47 per A ordinary share (“A Share”) and B ordinary share (“B Share”).
https://irssl.euroinvestor.com/asp/ir/IRM_Shell/ssl2017/NewsRead.aspx?storyid=13551375&ishtml=1
That $0.47 = 38.64p
Are you can see the Dividend of $0.47 remains the same quarter on quarter, but due the devaluation of £Sterling, the UK£ payment has increased by 1.48p per share.
BREXIT.
The Templeton Emerging Markets Investment Trust is a world class fund
With a market capitalisation of over £1,800 million
Its performance below shows how £1.50 has become £6.50
“It’s better to hang out with people better than you. Pick out associates whose behaviour is better than yours and you’ll drift in that direction”

https://www.youtube.com/watch?v=t_WE9kUDKkg
L&G Global Health & Pharmaceuticals Index
L&G Worldwide Trust
L&G Asian Income Trust
L&G US Index
L&G Global Technology Index
L&G Global Equity Index Fund
Emerging Markets Index Fund
L&G UK Property
https://www.legalandgeneral.com/investments/products-and-funds/actively-managed/other/
Global 100 Index Trust
International Index
Mixed Investment 0-20% Fund
Mixed Investment 0-35% Fund
Mixed Investment 20-60% Fund
Mixed Investment 40-85% Fund
London house prices are on a different plateau. London has become a separate economy to the rest of the UK.

Consider to areas in North West London. Harrow and Stanmore. They site in Zone 5 on the London Underground.
Semi-Detached Houses.
Harrow. Last sold in 2015 for £615,000
Stanmore: Last sold in 2016 for £802,000
The connection between salary and house price is broken.
Genius
Warren Buffet: Amazing Documentary on the worlds most successful investor. He takes The Long View
https://www.youtube.com/watch?v=2VlojxrCp9Q
Another month, guess what, take a lucky guess, it is the same old story, HM Government, spends more money than it receives via taxes and duties. Another deficit month, thus to bridge the gap, needs to borrow on the bond market.
In February 2017, the HM Government had to borrow money to meet the difference between tax revenues and public sector expenditure. The term for this is The PSNCR: The Public Sector Net Cash Requirement.
There were “only” 4 auctions of Gilts (UK Government Bonds) by the UK Debt Management Office (http://www.dmo.gov.uk/) to raise cash for HM Treasury:-
23-Feb-2017 1½% Treasury Gilt 2026 £2,299.9970 Million
15-Feb-2017 0 1/8% Index-linked Treasury Gilt 2026 £1,250.0000 Million
09-Feb-2017 1½% Treasury Gilt 2047 £2,624.2900 Million
07-Feb-2017 1¾% Treasury Gilt 2019 £3,004.2150 Million
When you add the cash raised:-
∑(£2,299.9970 Million + £1,250.0000 Million + £2,624.2900 Million + £3,004.2150 Million = £9,178.50 Million
£9,178.50 Million = £9.17850 Billion
On another way of looking at it, is in the 28 days in Feb, HM Government borrowed:-
£327 million each day for the 28 days.
We are fortunate, while the global banking and financial markets still has the confidence in HM Government to buy the Gilts (Lend money to the UK), the budget deficit keeps rising. What is also alarming, is the dates these bond mature 2019, 2026 and 2047. All long term borrowings, we are mortgaging our futures, but at least “We are in it together…”
Yesterday, the City of London Investment Trust paid out its Feb 2017 Dividend
4.05p a share.
https://www.henderson.com/ukpi/fund/169/the-city-of-london-investment-trust-plc
The yield is 3.9%
Now, the shares in issue are 336,484,868.
Thus:-
336,484,868 x 4.05p a share = £13,627,637.154
The dividend cost the trust, £13.6m in cash.
The SME Loan Fund is an investment vehicle listed on the London Stock Exchange managed by Amberton Asset Management.
http://ambertonam.com/the-sme-loan-fund/
A £49m Investment Company that is an alternative finance provider (A creditor) to Small and Medium Enterprises.
http://www.shareshop.hsbc.co.uk/shareshop/security.cgi?csi=45547223&action=
The yield is over 5%

The Intelligent Investor
it is useful to see what companies have out performed the FTSE-100 Index in the past 12months.
HSBC Holdings has done very well climbing from £4.50 to over £6.80. That equates to over 50% in 12months.
http://www.shareshop.hsbc.co.uk/shareshop/security.cgi?csi=10048&action=
The FTSE-100 has climbed only by 28%
http://www.shareshop.hsbc.co.uk/shareshop/security.cgi?csi=50058
Royal Borough of Kingston upon Thames has a fund that pays the pensions of its retired workers.
https://www.kingston.gov.uk/downloads/file/1740/pension_fund_annual_report_2015-16
Some interesting facts:
Income into the fund in 2016 was £41.5m
Expenditure out of the fund in 2016 was £34.4m
Thus a financial surplus in 2016.
“The Fund continues to be a growing Fund and cash flow positive, as contributions from members and employers exceed the cost of pensions and benefits payable”
The fund is worth £651.48m = 100.0%
Fidelity:
Global Equities Fund £157.5m = 24.17%
Emerging Market equities £16.579m = 2.54%
Cash and other investment balances £3.183m = 0.49%
ColumbiaThreadneedle:
Unitised Insurance Policy (Global equities) £122.398m = 18.79%
Schroders:
Other Managed Funds (Global equities) £86.511m =13.28%
Henderson:
Other Managed Funds (Bonds) £88.480m = 13.58%
UBS:
Property Unit Trusts £29.822m = 4.58%
Cash and other investment balances £1.703m = 0.26%
Pyrford:
Other Managed Funds (DGF) £73.420m = 11.27%
Standard Life:
Other Managed Funds (DGF) £70.078m = 10.76%
In house:
Cash £1.670m = 0.26%
A pension fund whose income is greater than its outgoings.
BP is one of the largest oil companies in the world.
http://www.bp.com
It is a huge company, whose value is nearly £100bn
One major component that makes up the value, are the reserves that BP has in the ground. One of the largest reserves is the Clair field.
“Clair Ridge is the second phase of development of the Clair field which, with an estimated eight billion barrels of oil in place, is the largest undeveloped hydrocarbon resource on the UKCS. Clair was discovered in 1977, but challenging reservoir characteristics and the technological limits of the time meant it was the mid-1990s before the field saw extensive drilling and 2001 before BP and partners approved a development plan.”
Because of the scale of the investment, it has four partners.
BP – 28.6%
ConocoPhillips – 24.0%
Chevron Corporation – 19.4%
Royal Dutch Shell – 28% (including 9.3% interest obtained from Hess in a swap in 2009)
BP is targeting 640 million barrels of recoverable resources
What is the value of this 640,000,000 barrels:
Brent Crude has an approximate value today of $55 = £44.
So 640,000,000 x £44 = £28,160,000,000
That is £28 Billion.
The value of the whole 8bn Barrels ?
easy:
8,000,000,000 barrels * £44 = £352,000,000,000
That is £352bn which is about 23% of UK Annual GDP.
The Legal and General UK Equity Income Fund is a £413.4 million Unit Trust managed by Legal and General.
An actively managed fund, with 80 holdings, its top ten are:-
Holding %
HSBC Holdings PLC 5.08%
Imperial Brands 4.85%
British American Tobacco 4.58%
AstraZeneca 4.46%
Vodafone Group 4.32%
Royal Dutch Shell A 4.28%
BP 4.09%
BT Group 3.75%
Lloyds Banking Group 3.48%
Prudential 3.27%
The top ten make up 42% of the fund.
The yield of the fund is 4%.
The past 12 months has seen amazing growth in the share price of Royal Dutch Shell B (RDSB). It has grown from about £14 a share to over £22. A gain of over 50%
http://www.shareshop.hsbc.co.uk/shareshop/security.cgi?csi=133755
Now compare this against the FTSE-100, which as grown by 28%.
http://www.shareshop.hsbc.co.uk/shareshop/security.cgi?csi=50058
See below:-
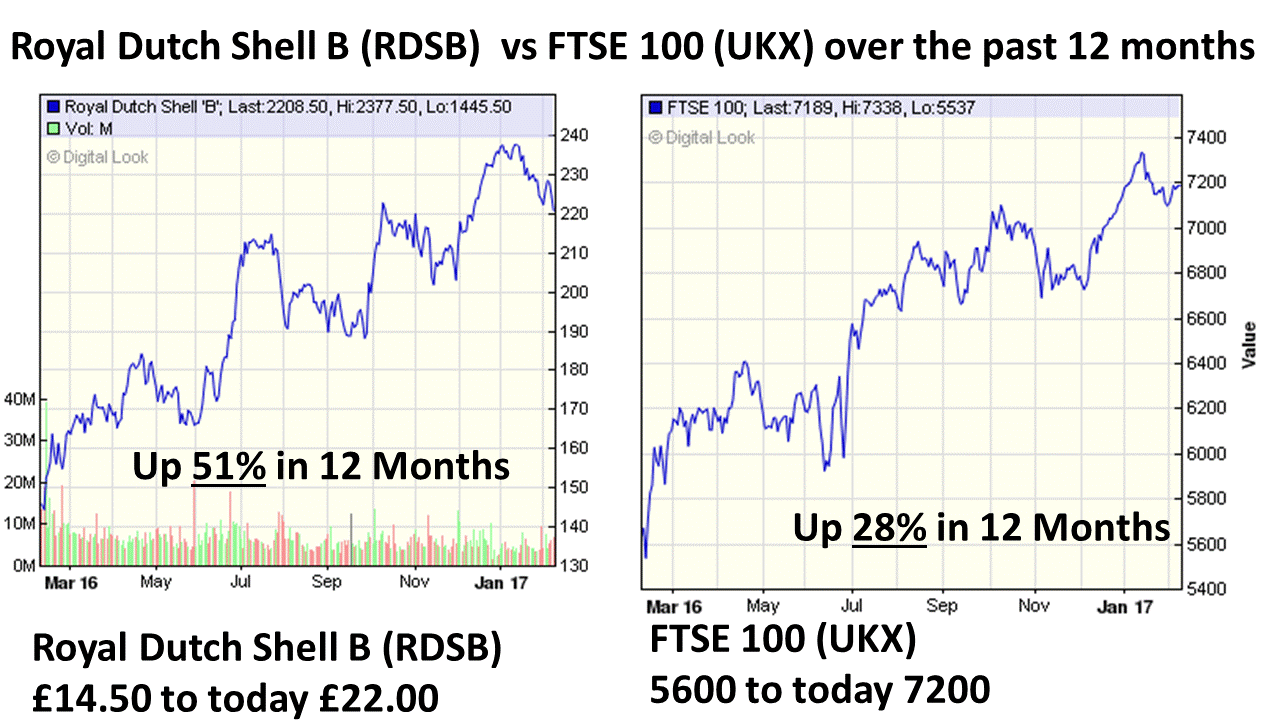
The JPMorgan Global Convertibles Income Fund Limited is a London Listed Investment Trust.
It holds investments in the following sectors:-
Communications 20.50 %
Real Estate 18.00 %
Consumer Cyclicals 12.10 %
Industrial 9.90 %
Consumer Non-cyclical 8.10 %
Other financials 6.30 %
Basic Materials 6.00 %
Banks 5.80 %
Technology 4.90 %
Energy 4.60 %
Utilities 3.80 %
http://www.shareshop.hsbc.co.uk/shareshop/security.cgi?csi=9768953&action=
A £175m Investment Fund, paying out 5% yield
Holding Security Description Market Value % of Fund
7,000,000.00 CHINA OVERSEAS FINANCE INVESTMENT CAYMAN V LTD PUTABLE CONVERTIBLE BOND ZERO CPN 05/JAN/2023 USD 5,898,312.86 2.90%
9,500,000.00 CAPITALAND LTD CONVERTIBLE BOND FIXED 1.85% 19/JUN/2020 SGD 250000 5,432,378.68 2.67%
6,000,000.00 SUBSEA 7 SA CONVERTIBLE BOND FIXED 1% 05/OCT/2017 USD 200000 4,828,405.39 2.37%
5,616,000.00 VEREIT INC CONVERTIBLE BOND FIXED 3.75% 15/DEC/2020 USD 1000 4,680,383.43 2.30%
5,277,000.00 REDWOOD TRUST INC CONVERTIBLE BOND FIXED 4.625% 15/APR/2018 USD 1000 4,333,026.97 2.13%
5,636,000.00 TWITTER INC CONVERTIBLE BOND FIXED 1% 15/SEP/2021 USD 1000 4,250,381.49 2.09%
5,000,000.00 INTERNATIONAL CONSOLIDATED AIRLINES GROUP SA CONVERTIBLE BOND FIXED .25% 17/NOV/2020 EUR 100000 4,152,612.93 2.04%
38,000,000.00 KINGSOFT CORP LTD PUTABLE CONVERTIBLE BOND FIXED 1.25% 11/APR/2019 HKD 1000000 3,973,427.62 1.95%
3,549,000.00 LIBERTY INTERACTIVE LLC CALLABLE CONVERTIBLE BOND FIXED 4% 15/NOV/2029 USD 930.3369 1,798,627.08 0.88%
2,635,000.00 LIBERTY INTERACTIVE LLC CALLABLE CONVERTIBLE BOND FIXED 3.75% 15/FEB/2030 USD 948.4356 1,297,644.19 0.64%
1,029,000.00 LIBERTY INTERACTIVE LLC CALL/PUT CONVERTIBLE BOND FIXED 1.75% 30/SEP/2046 USD 1000 847,034.99 0.42%
41,824,100.00 AIR FRANCE-KLM PUTABLE CONVERTIBLE BOND FIXED 2.03% 15/FEB/2023 EUR 10.3 3,912,947.65 1.92%
4,528,000.00 FANG HOLDINGS LTD PUTABLE CONVERTIBLE BOND FIXED 2% 15/DEC/2018 USD 1000 3,653,108.45 1.79%
4,545,000.00 YANDEX NV CONVERTIBLE BOND FIXED 1.125% 15/DEC/2018 USD 1000 3,564,450.49 1.75%
4,000,000.00 SGL CARBON SE CONVERTIBLE BOND FIXED 2.75% 25/JAN/2018 EUR 100000 3,425,344.50 1.68%
3,500,000.00 AABAR INVESTMENTS PJSC MEDIUM TERM NOTE FIXED 1% 27/MAR/2022 EUR 100000 2,294,038.06 1.13%
1,500,000.00 AABAR INVESTMENTS PJSC MEDIUM TERM NOTE FIXED .5% 27/MAR/2020 EUR 100000 1,080,801.69 0.53%
3,100,000.00 MARKET TECH HOLDINGS LTD PUTABLE CONVERTIBLE BOND FIXED 2% 31/MAR/2020 GBP 100000 3,158,900.00 1.55%
3,922,000.00 YY INC PUTABLE CONVERTIBLE BOND FIXED 2.25% 01/APR/2019 USD 1000 3,128,059.29 1.54%
3,750,000.00 HAITIAN INTERNATIONAL HOLDINGS LTD PUTABLE CONVERTIBLE BOND FIXED 2% 13/FEB/2019 USD 250000 3,125,256.03 1.54%
3,681,000.00 STARWOOD PROPERTY TRUST INC CONVERTIBLE BOND FIXED 3.75% 15/OCT/2017 USD 1000 3,092,248.11 1.52%
3,100,000.00 CARILLION FINANCE JERSEY LTD CONVERTIBLE BOND FIXED 2.5% 19/DEC/2019 GBP 100000 2,989,950.00 1.47%
3,600,000.00 DP WORLD LTD PUTABLE CONVERTIBLE BOND FIXED 1.75% 19/JUN/2024 USD 200000 2,922,843.87 1.44%
2,765.00 WELLS FARGO & CO. PREFERENCE 7.50% 2,921,492.41 1.44%
2,900,000.00 ST MODWEN PROPERTIES SECURITIES JERSEY LTD CONVERTIBLE BOND FIXED 2.875% 06/MAR/2019 GBP 2,753,550.00 1.35%
3,200,000.00 TOTAL SA MEDIUM TERM NOTE FIXED .5% 02/DEC/2022 USD 200000 2,718,257.09 1.34%
3,200,000.00 ZHEN DING TECHNOLOGY HOLDING LTD PUTABLE CONVERTIBLE BOND ZERO CPN 26/JUN/2019 USD 100000 2,647,227.52 1.30%
3,200,000.00 TELEFONICA SA MEDIUM TERM NOTE FIXED 6% 24/JUL/2017 EUR 100000 2,624,343.63 1.29%
2,900,000.00 IBERDROLA INTERNATIONAL BV CONVERTIBLE BOND ZERO CPN 11/NOV/2022 EUR 100000 2,585,313.56 1.27%
2,503.00 BANK OF AMERICA CORP. PREFERENCE 7.25% 2,520,631.15 1.24%
3,100,000.00 AMERICA MOVIL BV CONVERTIBLE BOND FIXED 5.5% 17/SEP/2018 EUR 100000 2,517,839.21 1.24%
2,500,000.00 VODAFONE GROUP PLC CONVERTIBLE BOND ZERO CPN 26/NOV/2020 GBP 100000 2,478,500.00 1.22%
Balance of portfolio 101,939,208.56 50.08%
Total portfolio 203,546,546.90 100.00%
Interesting to see that that the fund is at a massive discount. Assets of £203m and stock market valuation of £175m
Another way of looking at it is to say, it is like buying 203p for only 175p
The International Biotech Trust is a £220m London Listed Investment fund, that invests in the Biotech sector.
Top Ten:-
Celgene 7.5%
Biogen 6.8%
Genmab 6.4%
Alexion 5.8%
Actelion 5.0%
Gilead 4.5%
Tesaro 4.5%
Shire 4.5%
Regeneron 4.3%
Ariad 3.1%
Interesting to know that
Market Share Price is 550.0p
Net Asset Value is 620.4p
So effectively you are buying £6.20 for £5.50
Another month, guess what, take a lucky guess, it is the same old story, HM Government, spends more money than it receives via taxes and duties. Another deficit month, thus to bridge the gap, needs to borrow on the bond market.
In January 2017, the HM Government had to borrow money to meet the difference between tax revenues and public sector expenditure. The term for this is The PSNCR: The Public Sector Net Cash Requirement.
There were “only” 5 auctions of Gilts (UK Government Bonds) by the UK Debt Management Office (http://www.dmo.gov.uk/) to raise cash for HM Treasury:-
31-Jan-2017 1½% Treasury Gilt 2026 £2,444.0460 Million
18-Jan-2017 0½% Treasury Gilt 2022 £2,881.9490 Million
12-Jan-2017 2% Treasury Gilt 2025 £2,250.0000 Million
10-Jan-2017 0 1/8% Index-linked Treasury Gilt 2046 £837.7980 Million
05-Jan-2017 1¾% Treasury Gilt 2037 £2,329.9140 Million
When you add the cash raised:-
∑(£2,444.0460 Million + £2,881.9490 Million + £2,250.0000 Million + £837.7980 Million + £2,329.9140 Million = £10,743.707 Million
£10,743.707 Million = £10.743707 Billion
On another way of looking at it, is in the 31 days in January, HM Government borrowed:-
£346 million each day for the 31 days.
We are fortunate, while the global banking and financial markets still has the confidence in HM Government to buy the Gilts (Lend money to the UK), the budget deficit keeps rising. What is also alarming, is the dates these bond mature 2022, 2025, 2026 and 2037. All long term borrowings, we are mortgaging our futures, but at least “We are in it together…”
The world’s most dynamic media and communications company is BT PLC
Yesterday, BT paid its Feb 2017 dividend to its shareholders.
http://www.btplc.com/Sharesandperformance/Dividends/Dividends.htm
£0.0485 per share.
Now much did that cost BT plc ?
The total number of voting rights in BT Group plc on that date was 9,958,766,455
Thus:
9,958,766,455 x £0.0485 = £483,000,173.1
That is £483 MILLION.
http://www.shareshop.hsbc.co.uk/shareshop/security.cgi?csi=10025&action=
A yield of over 3%
Anybody who has lived or watched the prices of London homes for the past 20 years will tell you how much the city has changed. They could be talking about particular areas that were once considered undesirable, and are now flourishing, or they could be referring to the wealth of new businesses that have cropped up.
For example, areas like West Drayton are in the process of gentrification as Cross Rail arrives in 2017/18
In years gone by with the London 2012 Olympics, one has seen Stratford transformed.
I will now analyse average housing prices, salaries and the switch from buying to renting homes that many have chosen (or, perhaps more accurately, been forced into).
Housing Prices
Property prices in the UK have been growing in a pretty consistent manner over the years, and that rings true particularly in the nation’s capital.
The average price of a property in London, as of December 2016, is £487,649 (according to the Land Registry). This is 123 percent higher than the UK average (£217,888). London is known for being an expensive place to live. It’s always been that way. But younger individuals might be shocked to see how inexpensive, by today’s standards, the housing market was in 1996. Back then, the average price of a home was £79,000.
(In 1997 one could buy a detached house in the IP5 (Martlesham Heath in leafy Suffolk for £55,000)
As you can see, the rise in prices has grown consistently at a steep rate. Only following the 2008 recession did things get a little difficult, but now, they’re back on track. At the moment, the market is currently experiencing its steepest climb yet. It remains to be seen how things will work out in the future, but they look pretty strong right now.
Salary Growth, or Lack of first time buyers
The average first-time buyer in 1996 earned approximately £21,575 per year.
They borrowed, on average, around £55,575 from a mortgage lender in order to purchase their first home. Today, it is a very different story. Housing prices have increased, as we have seen, but salary raises haven’t been able to keep up. In 2016, a first-time-buyer typically needs to put down a deposit of £96,000 – and the average salary is only £51,000. That deposit figure is ten times what it was in 1996, while buyers today borrow an average of £174,000. So, obviously, it is now much more difficult to become a homeowner. And these figures are based on those who did manage to get a mortgage. I don’t know the number of people who would have been able to purchase a home, if salaries had risen at the same rate as housing prices. One of the reasons housing prices have risen so fast is because of a lack of supply. Therefore, it is incredibly important that new-build projects receive significant investment. There are sure to be a few people priced out of property, who instead are renting a place to live. Which leads onto our next point as to how the property market has changed.
Buying vs Renting
In 2001, approximately 15 percent of people who were living in London did not own their property. Instead, they were renting. Today, however, that figure has shot up to around 33 percent. It is difficult to argue that this is because of anything other than housing prices being too high for many people. Although there may be a few exceptions. Some people don’t like to be tied down, for example. But this has proven to be good news for the buy-to-let marketplace. There is a constant need for rental properties, and many investors have found success in this area. And according to research conducted by PwC, things are only going to get better for these individuals. By 2025, around 60 percent of Londoners will be renting.
Vodafone PLC pays out a dividend of €0.0474 today.
The UK’s No 2 telecoms operator, behind the market leader and world beating BT Group PLC
The total number of voting rights in Vodafone is 26,617,945,523.
http://otp.investis.com/clients/uk/vodafone3/rns/regulatory-story.aspx?cid=221&newsid=832585
So the cash paid out to shareholders is:
26,617,945,523 x €0.0474 = €1,261,690,617.79
€1,261,690,617 = £1,110,590,000
Vodafone pays out £1.110 Billion.
http://www.shareshop.hsbc.co.uk/shareshop/security.cgi?csi=10097
A yield of 5%
The New River Real Estate Investment Trust is a near £800m London Listed investment trust investing in property.
The portfolio is:-
£1.3 billion Assets Under Management
96 % Occupancy
33 Shopping Centres
22 Retail Warehouses
15 High Street Assets
358 Pubs
http://www.shareshop.hsbc.co.uk/shareshop/security.cgi?csi=2057097&action=
Borrowings of £470.8m
The Debt of Marks and Spencer
Marks and Spencer PLC, the famous UK retailer, has a debt programme to fund its business operations.
http://corporate.marksandspencer.com/investors/debt-investors#edbb67e737a24f9d86ad48628067e7e5
April 2021 Syndicated revolving credit facility £1.1bn
2017 US$500m 6.250% Semi-annually
2019 £400m 6.125% Annually
2021 £300m 6.125% Annually
2037 US$300m 7.125% Semi-annually
2025 £400m 4.750% Annually
That equates to:-
£1,100m + US$500m + £400m + £300m + US$300m + £400m =
£1100m + £405m + £400m + £300m + £243m + £400m = £2,848m
that is £2.848 Billion
The picture below shows the dangers of a concentration of risk in one asset.

In the past days the FTSE has moved little, with highs of over 7,200 to lows of 7135. That is about a movement of 1%
BT plc has traded this week from £3.80 to as low as £2.99. That is price movement of 20%
The benefits of a fund like a FTSE-100 tracker is obvious. Never have all your eggs in one basket.
The M&G High Income Investment Trust is an London Listed Investment Trust. The Company was incorporated on 23 December 1996 and is a split capital investment trust company with three share classes (Zero Dividend Preference Shares, Income Shares and Capital Shares).
It’s top twenty holdings are:
Treasury 1.00% 2017 8.90% ‘AAA’ credit rated bonds
Treasury 1.25% IL 2017 8.69% ‘AAA’ credit rated bonds
Royal Dutch Shell ‘B’ 4.30% Oil & gas producers
British American Tobacco 4.16% Tobacco
AstraZeneca 3.61% Pharmaceuticals & biotechnology
GlaxoSmithKline 3.45% Pharmaceuticals & biotechnology
HSBC Holdings 3.00% Banks
Vodafone Group 2.70% Mobile telecommunications
BP 2.56% Oil & gas producers
Sage Group 2.19% Software & computer services
Unilever 2.07% Food producers
Imperial Tobacco 2.02% Tobacco
Aviva 1.91% Life insurance
BT Group 1.80% Fixed line telecommunications
RELX 1.79% Media
National Grid 1.62% Gas, water & multi-utilities
United Utilities 1.62% Gas, water & multi-utilities
Legal & General Group 1.57% Life insurance
Essentra 1.49% Support services
Rio Tinto 1.34% Mining
Twenty largest holdings 60.79% = £254million
http://docs.mandg.com/AR/MandG-High-Income-Investment-Trust_Annual-Report-and-Accounts_GB_ENG.pdf
One of the largest money managers in the world is Norges Bank. It is the Central Bank of Norway, and manages the profits from its oil industry.
Over 7,500 BILLION Krona = £700 Billion = €833 Billion = $869 Billion.
It manages the money with investments in Shares, Fixed Income (bonds) and Real Estate.
It also has manadates with external fund managers:-
External Equity Fund Managers
◾3G Radar
◾A/T Capital Management
◾Abax Investments
◾Ajeej Capital
◾Altus TFI
◾AM Advisors
◾Andino
◾Ashmore Equities Investment Management
◾B & P Asset Management
◾ATR Kim Eng Capital Partners
◾Avaron Asset Management
◾BlackRock
◾BPH TFI
◾Capital International Limited
◾Cephei Capital Management
◾CIM Investment Management
◾Concorde Asset Management
◾DNB Asset Management
◾Dragon Capital Management
◾Duet Mena
◾Eastspring Investments
◾Ecofin
◾Ellerston Capital
◾ENAM Asset Management
◾Fairtree Capital
◾Financiere Arbevel
◾Foord Asset Management
◾FPM Frankfurt Performance Management
◾GCA Investment Management
◾Gondo Visio and Visio Capital Management
◾Greenwoods Asset Management
◾Investec Asset Management
◾Ion Value Management
◾Kairos Partners
◾Karma Capital Advisors
◾Keel Capital
◾Keywise Capital Management
◾Krungsri Asset Management
◾Laurium Capital
◾Lazard Asset Management
◾Levin Capital Strategies
◾Lynear Wealth Management
◾Maybank Asset Management
◾Meritz Asset Management
◾Mirabaud Asset Management
◾Moneda Asset Management
◾Nabo Capital
◾Neuberger Berman Asia
◾Obafrica AM and La Financiere de l’Echiquier
◾Old Mutual Global Investors
◾Operadora GBM
◾Pacific Alternative Asset Management Company
◾Prosperity Capital Management
◾Quantum Advisors Private Limited
◾Rasmala Asset Management
◾Red Gate Asset Management
◾Rheos Capital Works
◾Schroder Investment Management
◾Sparx Asset Management
◾Specialised Research
◾Springs Capital
◾Squadra Investments
◾Steyn Capital Management
◾Templeton Asset Management
◾Temporis Capital
◾Verno Capital
◾Victoire Brasil Investimentos
◾VIP Research & Management
◾Visio Capital Management
◾Water Asset Management
External Fixed-Income Managers
◾Ashmore Equities Investment Management
◾Investec Asset Management
◾Templeton Asset Management
The loss of well paid banking jobs due to Brexit can not be under estimated.
http://www.bbc.co.uk/news/business-38677504
So HSBC and UBS are saying 2,000 investment banking jobs are going to be out transferred of London.
What does this mean financially ?
So lets make some rough calculations:-
HSBC: 1,000 jobs to leave London.
If the average wage of an investment banker at HSBC is £115,000 then the wage bill that leaves London is:
1,000 * £115,000 = £115,000,000 (£115 Million)
UBS: 1,000 jobs to leave London.
If the average wage of an investment banker at UBS is £125,000 then the wage bill that leaves London is:
1,000 * £125,000 = £125,000,000 (£125 Million)
The taxs that will be lost by the UK Goverment:-
HSBC: Wage bill of £115,000,000 and assume 45% goes in total due to income tax and national insurance.
That is £51,750,000 (£51.75 Million)
UBS: Wage bill of £125,000,000 and assume 45% goes in total due to income tax and national insurance.
That is £51,750,000 (£56.250 Million)
A total loss of £108,000,000 (£108m). That is £108m less for HM Government to spend on UK defence, public services like hospitals, schools, universities or police.
Now what else you have to remember, is the salaries after tax, are known as disposable income.
HSBC wage bill of £115 Million, 45% lost in tax (£51.75 Million) leaving £63,250,000) to be spend by employees.
That money is for travel, paying for London Transport, on Oyster or Taxi / Uber. Eating in restaurants, or cinema or buying food at Tesco.
All money that is now lost.
UBS wage bill of £125 Million, 45% lost in tax (£56.250 Million) leaving £68.750) to be spend by employees.
That money is for travel, paying for London Transport, on Oyster or Taxi / Uber. Eating in restaurants, or cinema or buying food at Tesco.
All money that is now lost.
That money supports local jobs, cinema workers, supermarket workers, taxi drivers.
Also those 2,000 people are not paying council tax.
Average Council tax of say £1,100 a year.
2,000 * £1,100 = £2,200,000.00 (£2.2 million) less for councils which means less cash for social care, libraries, refuse/trash collection, street cleaning.
Brexit. Loss of cash for the UK. Serious indeed, and www.asadkarim.co.uk calculations are just on 2,000 jobs.

The Sanditon Investment Trust plc in a London listed investment company. It invests predominantly in listed equity securities of companies
• which derive a significant proportion of their revenues or profits from; or
• which are predominantly operating in the EU, the EEA or Switzerland.
Top 10 Long Positions:-
Babcock International 6.9%
RELX 5.1%
Melrose Industries 4.3%
Diageo 3.1%
Man Group 2.9%
Laird 2.8%
ITV 2.7%
Sanditon Asset Management 2.6%
BHP Billiton 2.4%
HSBC 2.2%
Total 35.0
Last week on Thursday 12th Jan, GlaxoSmithKline paid its dividend to its shareholders.
It was 19p a share.
The total number of voting rights in the Company is 4,910,110,112
http://www.londonstockexchange.com/exchange/news/market-news/market-news-detail/GSK/13083316.html
So the cost of the dividend to GSK was:
4,910,110,112 * £0.19 = £932,920,921.28
That is £932 Million of Cash.
http://www.shareshop.hsbc.co.uk/shareshop/security.cgi?csi=10042
That is a 5% yield.
The Aberdeen Frontier Markets Investment Company is a £100m investment company, whose objective is to provide shareholders with long term capital growth by investing in the Frontier
Markets of Africa, the Middle East, Eastern Europe, Asia and Latin America.
It’s top ten holdings that make up 65% of the fund are:
Advance Copernico Argentina Fund Argentina 8.6%
East Capital Balkan Fund – C Class Balkans 8.3%
Fondul Proprietatea GDR Romania 8.1%
Tundra Pakistan Fund Pakistan 7.6%
VinaCapital Vietnam Opp. Vietnam 7.0%
PXP Vietnam Emerging Equity Fund Vietnam 6.8%
Sturgeon Central Asia Equities Fund Asia 6.0%
SCM Africa Fund Africa 4.9%
SC Africa Consumer Fund Africa 4.2%
MSCI Pakistan Pakistan 3.9%
Total 65.6%
http://www.shareshop.hsbc.co.uk/shareshop/security.cgi?csi=232655
A yield of 1.5%
The most famous shop on the UK high street is the highly regarded Marks and Spencer
http://www.marksandspencer.com
Today, Friday 13th Jan 2017 Marks and Spencer pays it dividend.
It is 6.8p a share.
How much will this cost Marks and Spencer PLC today ?
http://otp.investis.com/generic/regulatory-story.aspx?newsid=832422&cid=228
The Company’s capital consists of 1,624,726,830 ordinary shares with voting rights
So 1,624,726,830 x £0.068 = £110,481,424.44
£110m leaves the bank account today.
Another month, guess what, take a lucky guess, it is the same old story, HM Government, spends more money than it receives via taxes and duties. Another deficit month, thus to bridge the gap, needs to borrow on the bond market.
In December 2016, the HM Government had to borrow money to meet the difference between tax revenues and public sector expenditure. The term for this is The PSNCR: The Public Sector Net Cash Requirement.
There were “only” 4 auctions of Gilts (UK Government Bonds) by the UK Debt Management Office (http://www.dmo.gov.uk/) to raise cash for HM Treasury:-
14-Dec-2016 0 1/8% Index-linked Treasury Gilt 2036 £800.0000 Million
07-Dec-2016 1½% Treasury Gilt 2047 £2,250.0000 Million
06-Dec-2016 1½% Treasury Gilt 2026 £2,668.5700 Million
01-Dec-2016 0½% Treasury Gilt 2022 £3,122.8290 Million
When you add the cash raised:-
∑(£800.0000 Million + £2,250.0000 Million + £2,668.5700 Million + £3,122.8290 Million = £8,841.399 Million
£8,841.399 Million = £8.841399 Billion
On another way of looking at it, is in the 31 days in December, HM Government borrowed:-
£285million each day for the 31 days.
We are fortunate, while the global banking and financial markets still has the confidence in HM Government to buy the Gilts (Lend money to the UK), the budget deficit keeps rising. What is also alarming, is the dates these bond mature 2022, 2026, 2036 and 2047. All long term borrowings, we are mortgaging our futures, but at least “We are in it together…”
The UK High Street is dominated by Costa Coffee on every shopping street.
Costa Coffee is owned by the Whitbread group
To fund operations, apart from the cash generated by the business, Whitbread has a bond issuance programme.
https://www.whitbread.co.uk/investors/key-financial-information/corporate-debt.html
When you add the debt securities issued it comes to £1,706.90 Million.
That is £1.7bn of debt.
Lets keep things in context, its sales are in 15.16 were £2,921.8m.
Yesterday, 6th Jan, Rolls Royce PLC, one of the most highly regarded engineering companies in the world, paid its dividend to its shareholders.
It was 4.6p per share.
How cash did the dividend cost Rolls Royce PLC ?
The issued share capital of the Company is comprised off 1,838,787,676 ordinary shares of 20p each with voting rights.
http://otp.investis.com/clients/uk/rolls-royce1/rns/regulatory-story.aspx?cid=171&newsid=822957
Thus
1,838,787,676 x £0.046 = £84,584,233.10
£84m in cash.
Now Blackrock own 5% of Rolls Royce:
http://otp.investis.com/clients/uk/rolls-royce1/rns/regulatory-story.aspx?cid=171&newsid=820016
they have 92,012,850 shares, so they got 92,012,850 * £0.046 = £4,232,591.10 in cash, that is £4.2m
Picture the situation in London. Rent is £1000 a month for a small flat. The tenant is a driver for Uber. Now this person works all day as a self employed driver. They earn about £9 a hour.
One then has to look at the real picture. So they have to run the car, fuel it, pay for wear and tear on the car, such a tyres.
Then they need to pay themselves a wage. The income is based on picking up passengers. It is not constant.
Wages are low. Tax collected then by the government is low. National Insurance collected by the government is low.
Rent paid by the driver is high, at £1000 a month. The numbers do not work.
Living standards are falling. Taxes collected by government to pay for key public services are falling. People are just making a living.
Today, the TR Property Investment Trust, a London listed FTSE-250 Real Estate investment fund paid out a dividend of 4.1p per share.
It invests in Pan European equities and UK direct property on behalf of its shareholders.
It’s top ten indirect holdings are:-
Top Ten Holdings
UNIBAIL-RODAMCO 10.4%
LAND SECURITIES GROUP PLC 7.6%
VONOVIA SE 7.0%
LEG IMMOBILIEN AG 6.2%
KLEPIERRE 5.4%
FONCIERE DES REGIONS 3.1%
BUWOG AG 2.7%
DEUTSCHE WOHNEN AG 2.6%
SEGRO PLC 2.5%
HISPANIA ACTIVOS INMOBILIARIOS SAU 2.5%
It then holds direct properties in its portfolio which accounts for just over 8% of its total holdings:
Strategic allocation (%)
UK Shares 32.3
UK Direct Property 8.8
Continental Shares 71.2
Debt -12.3
TOTAL 100.0 %
Happy New Year !!

“Investment is crucial. Because the truth is, you only get jobs and growth in the economy when people invest money, at their own risk, in setting up a business or expanding an existing business.”
Tomorrow, HICL Infrastructure pays out £0.0191 on Dec 30th 2016.
https://otp.tools.investis.com/clients/uk/hicl/rns/regulatory-story.aspx?cid=1239&newsid=816302
HICL is now a member of the FTSE-250, it began life known as HSBC Infrastructure.
The Company’s issued share capital consists of 1,457,706,805 ordinary shares
https://otp.tools.investis.com/clients/uk/hicl/rns/regulatory-story.aspx?cid=1239&newsid=801023
That means the total cost of the dividend to HICL was:-
1,457,706,805 ordinary shares x £0.0191 = £27,842,199.98
That is £27.84 Million.
http://www.shareshop.hsbc.co.uk/shareshop/security.cgi?csi=185903&action=
A yield of 4.5%
School fees for public schools in the UK have no connection to the salaries of the middle classes.
1. Eton College
http://www.etoncollege.com/currentfees.aspx
£12,354 per term = £37,062 per year
2. Harrow School (near South Ruislip)
http://www.harrowschool.org.uk/Fees-and-Deposits
£12,450 per term = £37,350 per year
3. Framlingham School (Suffolk)
http://www.framcollege.co.uk/Admissions-Fees
£6,211.50 per term = £18,634.50 per year (non boarding)
4. Ipswich School
http://www.ipswichhighschool.co.uk/Fees-and-scholarships
£4,458 per term = £13,374 per year (non boarding)
4 examples of the fees that parents may have to pay. It is now becoming unaffordable for the middle classes as those numbers are paid from bank accounts AFTER tax. So Harrow fees of £37,350 per year is actually a £60,000 annual salary in approximate terms !!
Merry Xmas.
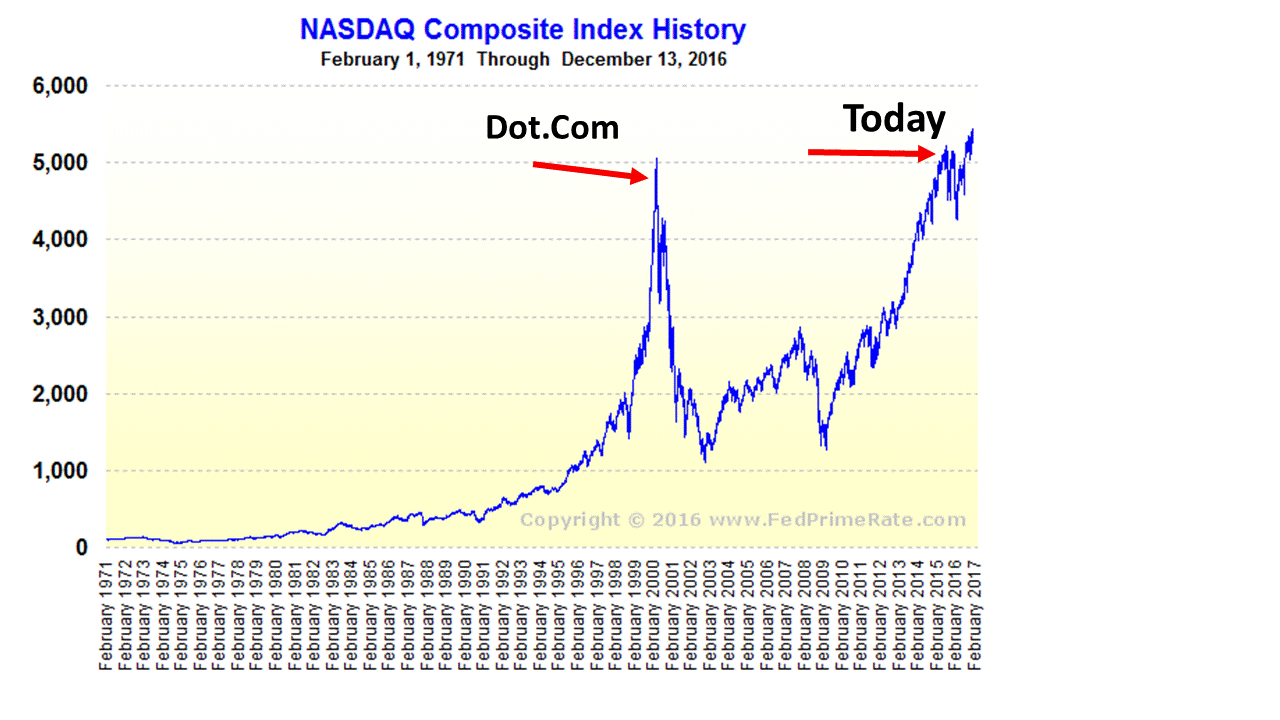
Look at the Graph. Today the Nasdaq Composite is at over 5,000 points. In Dec 1996 it was at 1,000 points, then rocketed to just over 5,000 by Jan 2000 with the Dot.Com bubble.
in 20 years you would have made 5 Times your money. Index trackers are beautiful.
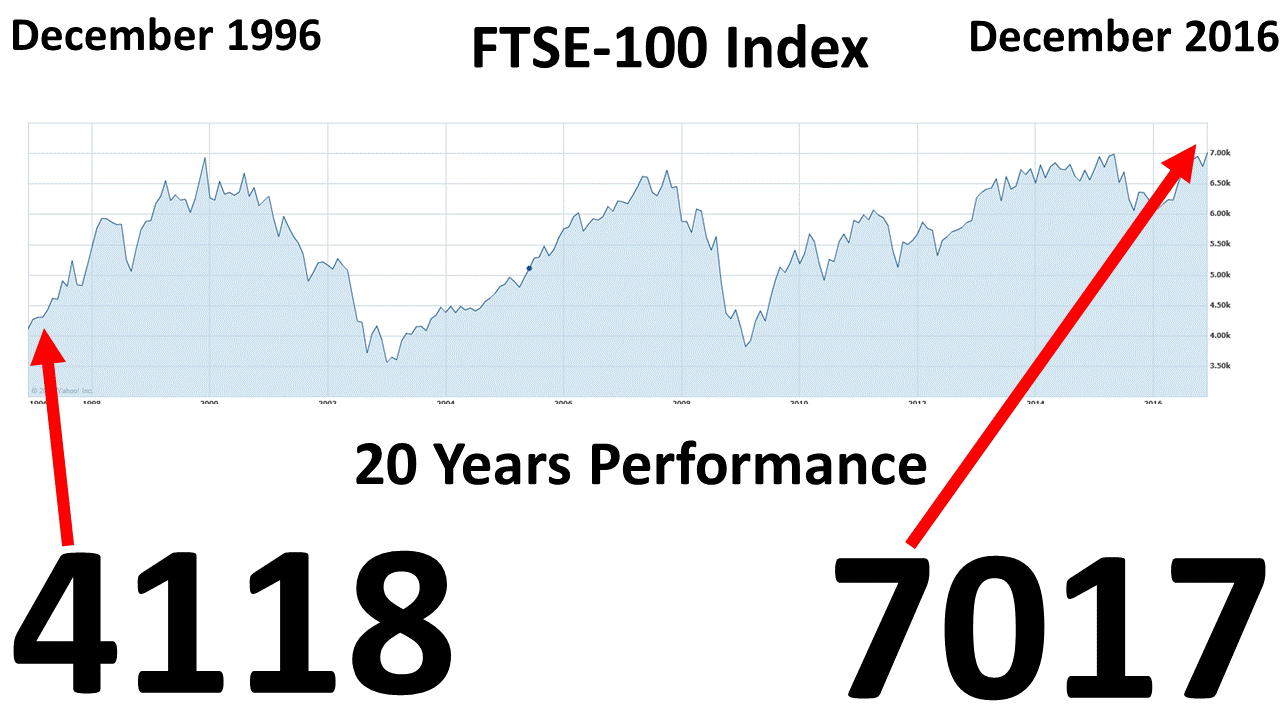
In December 1996, the FTSE-100 was at 4118 Points
In December 2016, the FTSE-100 was at 7017 Points
Index trackers are beautiful.