The Renewables Infrastructure Group December 2020 Dividend
Today, the FTSE250 company The Renewables Infrastructure Group pay out its Dec 2020 dividend.
It owns:-
45 Wind farms
28 Solar farms
01 Battery Storage
The total number of Ordinary Shares in issue on Admission will be 1,903,402,338 each with one voting right.
Thus:-
1,903,402,338 x £0.0169 = £32,167,499.5122
That is £32million
The Vanguard Total Stock Market Index Fund
The Vanguard Total Stock Market Index Fund
Created in 1992, Vanguard Total Stock Market Index Fund is designed to provide investors with exposure to the entire U.S. equity market, including small-, mid-, and large-cap growth and value stocks
https://investor.vanguard.com/mutual-funds/profile/portfolio/vtsmx
The assets of this fund are now $1 Trillion.
L&G Clean Energy UCITS ETF
The L&G Clean Energy UCITS ETF is a listed Exchange Traded Fund that invests in Clean Energy companies
https://fundcentres.lgim.com/uk/professional/fund-centre/ETF/Clean-Energy?isin_code=IE00BK5BCH80
The L&G Clean Energy UCITS ETF (the “Fund”) is a passively
managed exchange traded fund (“ETF”) that aims to track the
performance of the Solactive Clean Energy Index NTR (the “Index”)
https://www.londonstockexchange.com/stock/RENG/legal-and-general-asset-management/company-page
The graph speaks volumes

Merry Xmas
Blackrock Clean Energy ETF
What is “The Great Reset” & Why are People So Worried About It?
BP December 2020 Dividend.
Yesterday, BP PLC paid out its quarterly dividend.
This is an oil major.
$0.0525 (3.9169p) a share.
https://www.londonstockexchange.com/news-article/BP./total-voting-rights/14774649
The total number of voting rights in BP p.l.c. is 20,273,698,735
Thus:
20,273,698,735 x 0.039169 = £794,100,505.751215
That is £794 Million.
https://www.londonstockexchange.com/stock/BP./bp-plc/company-page
Royal Dutch Shell: December 2020 Dividend.
Yesterday, (Wed 16th Dec 2020), Royal Dutch Shell paid out its quarterly dividend.
Shell PLC is a dual listed company, Shell A and Shell B shares.
RDSA Royal Dutch Shell A, pays out $0.1665 (12.48p) a share.
RDSB Royal Dutch Shell B, pays out $0.1665 (12.48p) a share.
Royal Dutch Shell plc’s capital as at 30 November 2020, consists of 4,101,239,499 A shares and 3,706,183,836 B shares, each with equal voting rights. Royal Dutch Shell plc holds no ordinary shares in Treasury.
https://www.londonstockexchange.com/news-article/RDSA/voting-rights-and-capital/14774381
Thus:
4,101,239,499 x £00.1248 = £511,834,689.4752
3,706,183,836 x £00.1248 = £462,531,742.7328
That is £511,834,689.4752 + £462,531,742.7328 = £974,366,432.208.
That is £974 Million
https://www.londonstockexchange.com/stock/RDSA/royal-dutch-shell-plc/company-page
Investment in Meat (said with a German accent)
HM Government Borrowings Nov 2020
Another month, guess what, take a lucky guess, it is the same old story, HM Government, spends more money than it receives via taxes and duties.
Now we are in a Covid 19 world. UK’s HM Government needs to fund many new demands. [www.dmo.gov.uk]
https://www.dmo.gov.uk/dmo_static_reports/Gilt%20Operations.pdf
Another deficit month, thus to bridge the gap, needs to borrow on the bond market In October 2020 , the HM Government had to borrow money to meet the difference between tax revenues and public sector expenditure. The term for this is The PSNCR: The Public Sector Net Cash Requirement. There were “only” 15 auctions of Gilts (UK Government Bonds) by the UK Debt Management Office to raise cash for HM Treasury:-
24-Nov-2020 1¼% Treasury Gilt 2027 £3,002.7500 Million
24-Nov-2020 1¾% Treasury Gilt 2057 £1,562.4990 Million
18-Nov-2020 0 5/8% Treasury Gilt 2035 £2,500.0000 Million
17-Nov-2020 0 1/8% Treasury Gilt 2024 £4,062.4990 Million
17-Nov-2020 0 5/8% Treasury Gilt 2050 £2,500.0000 Million
12-Nov-2020 0¼% Treasury Gilt 2031 £3,749.9990 Million
12-Nov-2020 1 5/8% Treasury Gilt 2054 £1,562.4990 Million
11-Nov-2020 0 1/8% Index-linked Treasury Gilt 2036 3 months £861.4000 Million
04-Nov-2020 0 1/8% Treasury Gilt 2026 £3,000.0000 Million
03-Nov-2020 0 1/8% Treasury Gilt 2028 £3,405.6250 Million
03-Nov-2020 1¼ % Treasury Gilt 2041 £2,499.9990 Million
[£3,002.7500 Million+£1,562.4990 Million+£2,500.0000 Million+£4,062.4990 Million+£2,500.0000 Million+£3,749.9990 Million+£1,562.4990 Million+£861.4000 Million+£3,000.0000 Million+£3,405.625 Million+£2,499.9990 Million = £28,707.27 Million]
£28,707.27 Million = £28.70727 Billion
On another way of looking at it, is in the 30 days in November 2020, HM Government borrowed:- £956.909 Million each day for the 30 days.
We are fortunate, while the global banking and financial markets still has the confidence in HM Government to buy the Gilts (Lend money to the UK), the budget deficit keeps rising. What is also alarming, is the dates these bond mature from 2024 through to 2045. All long term borrowings, we are mortgaging our futures, but at least “We Are In It Together….”
Paul Krugman: A word from the wise
Helium One.
The world is running out of Helium.
Despite its prevalence across the universe, helium is rare on Earth. It is usually found with oil and natural gas. The US is the world’s largest producer, accounting for roughly 40% of supply. However, the US National Helium Reserve in Amarillo, Texas, the world’s single largest source of helium for the past 70 years, is now exhausted.
Apart filling birthday balloons. It plays a critical role in a number of high-tech applications, from barcode readers to semiconductors to liquid-crystal display (LCD) panels. Magnetic resonance imaging (MRI) machines can’t work without it. Google, Netflix and Amazon have been buying massive quantities of it for their data centers
However there are opportunities to invest in Helium explorers.
Helium One is a new London Listed company looking for Helium in Tanzania.
Its shares were listed on Fridy 4th Dec 2020
https://polaris.brighterir.com/public/helium_one/news/rns/story/x2jm9zw
https://www.londonstockexchange.com/stock/HE1/helium-one-global-ltd/company-page
The Ashoka India Equity Investment Trust PLC
The Ashoka India Equity Investment Trust PLC is a London listed investment trust investing in India.
TOP 10 HOLDINGS (as at 30 November, 2020)
ICICI Bank Financials 6.8% of the fund
Infosys Information Technology 6.6% of the fund
Bajaj Finserv Financials 5.6% of the fund
HDFC Bank Financials 5.3% of the fund
Nestle India Consumer Staples 5.0% of the fund
Asian Paints Materials 4.3% of the fund
Coforge Information Technology 3.9% of the fund
Kotak Mahindra Bank Financials 3.0% of the fund
Garware Technical Fibres Consumer Discretionary 3.0% of the fund
Navin Fluorine International Materials 2.9% of the fund
Total Portfolio 46.4% are the top 10 holdings.
https://www.londonstockexchange.com/stock/AIE/ashoka-india-equity-investment-trust-plc/company-page
The graph below makes interesting viewing.
Ray Dalio: Don’t Own Bonds, Don’t Own Cash
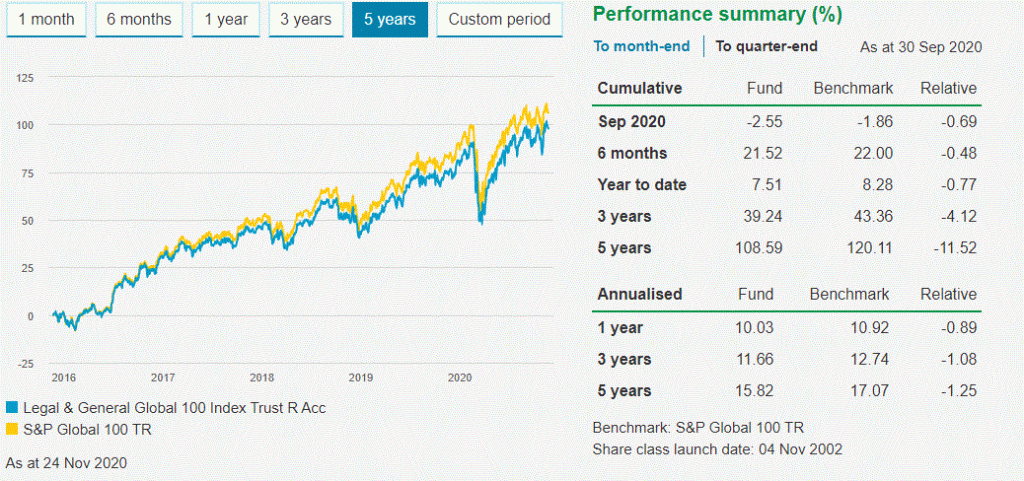
The Legal & General Global 100 Index Trust
The Legal & General Global 100 Index Trust is an Index fund, the objective of the Fund is to provide growth by tracking the capital performance of the S&P Global 100 Index
Top 10 holdings (%):-
Apple Inc 13.1% of the fund
Microsoft Corp 11.1% of the fund
Amazon.Com Inc 9.4% of the fund
Alphabet Cl A 3.1% of the fund
Alphabet Cl C 3.0% of the fund
Johnson & Johnson 2.7% of the fund
Nestle 2.4% of the fund
Procter & Gamble Company 2.4% of the fund
JPMorgan Chase & Co 2.1% of the fund
Samsung Electronics Co Ltd 1.8% of the fund
£308.8m fund.
Wise Warren Buffet Quote
Give Back to Society
“If you’re in the luckiest 1% of humanity, you owe it to the rest of humanity to think about the other 99%.”
Warren Buffett and his wisdom
Ray Dalio on Inflation that is on the horizon
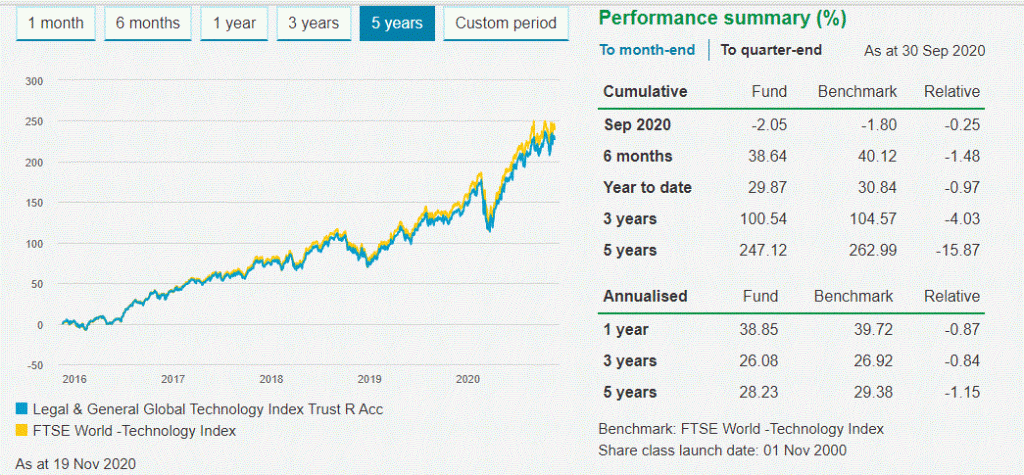
The Legal and General Global Technology Index Fund.
The Legal and General Global Technology Index Fund is a Unit Trust. The objective of the Fund is to provide growth by tracking the performance of the FTSE World -Technology Index (the “Index”). This objective is after the deduction of charges and taxation.
£967.2m of Technology assets.
Top 10 holdings (%)
Apple Inc 16.5% of the fund
Microsoft Corp 13.4% of the fund
Facebook 4.6% of the fund
Alphabet Cl A 4.1% of the fund
Alphabet Cl C 4.1% of the fund
Taiwan Semiconductor Manufacturing 3.4% of the fund
Nvidia Corp 3.0% of the fund
Adobe Inc 2.2% of the fund
Samsung Electronics Co Ltd 2.2% of the fund
Intel Corp 2.1% of the fund
The graph below shows its growth:-
The Polar Capital Technology Investment Trust plc
The Polar Capital Technology Investment Trust plc is a London listed investment trust.
https://www.polarcapitaltechnologytrust.co.uk/
£2,972.87m is it market capitalisation
Its top 15 holdings (%)
Apple 9.3% of the trust
Microsoft 8.2% of the trust
Alphabet 6.3% of the trust
Facebook 5.0% of the trust
Alibaba 4.0% of the trust
Tencent 3.8% of the trust
Samsung 2.8% of the trust
Amazon.com 2.6% of the trust
Taiwan Semiconductors 2.6% of the trust
Adobe Systems 2.2% of the trust
NVIDIA 2.0% of the trust
Advanced Micro Devices 1.8% of the trust
Salesforce.com 1.7% of the trust
Netflix 1.4% of the trust
Qualcomm 1.3% of the trust
https://www.londonstockexchange.com/stock/PCT/polar-capital-technology-trust-plc/company-page
The graph below shows its growth:-

Sainsburys Bank
Their is news in the media, that Sainsbury’s Bank (part of the Sainsbury’s supermaket group) is to be sold to National Westminister Group.
Some figures from the Sainsbury’s annual report
Customer deposits of £6300 million.
Customer lending £7400 million
Ray Dalio on the Economy
Legal & General Japan Index Trust
The Legal & General Japan Index Trust in an Index Fund managed by Legal and General.
A £1,321.9m fund. The objective of the Fund is to provide growth by tracking the capital performance of the FTSE Japan Index
Its top ten holdings are:
Toyota Motor Corp 4.2% of the fund
Sony Corp 2.4% of the fund
Softbank Group Corp 2.3% of the fund
Keyence Corp 2.2% of the fund
Nintendo 1.6% of the fund
Daiichi Sankyo Co Ltd 1.5% of the fund
Takeda Pharmaceutical Co Ltd 1.4% of the fund
Shin-Etsu Chemical Co Ltd 1.3% of the fund
Mitsubishi UFJ Financial Group 1.3% of the fund
Recruit Holdings Co Ltd 1.3% of the fund
It invests across 10 sectors:
Industrials 24.0% of the fund
Consumer Goods 22.7% of the fund
Health Care 11.6% of the fund
Financials 11.2% of the fund
Consumer Services 9.9% of the fund
Technology 6.8% of the fund
Telecommunications 6.2% of the fund
Basic Materials 5.5% of the fund
Utilities 1.5% of the fund
Oil & Gas 0.6% of the fund
Investment in ONE
Or do you feel the same?
Will it make it easier on you now?
You got someone to blame
You say one love, one life (One life)
It’s one need in the night
One love (one love), get to share it
Leaves you darling, if you don’t care for it
Did I disappoint you?
Or leave a bad taste in your mouth?
You act like you never had love
And you want me to go without
Well it’s too late, tonight
To drag the past out into the light
We’re one, but we’re not the same
We get to carry each other
Carry each other
One, one
One, one
One, one
One, one
Have you come here for forgiveness?
Have you come to raise the dead?
Have you come here to play Jesus?
To the lepers in your head
Well, did I ask too much, more than a lot?
You gave me nothing, now it’s all I got
We’re one,…
HM Government Borrowings: October 2020
Another month, guess what, take a lucky guess, it is the same old story, HM Government, spends more money than it receives via taxes and duties.
Now we are in a Covid 19 world. UK’s HM Government needs to fund many new demands. [www.dmo.gov.uk]
https://www.dmo.gov.uk/dmo_static_reports/Gilt%20Operations.pdf
Another deficit month, thus to bridge the gap, needs to borrow on the bond market In October 2020 , the HM Government had to borrow money to meet the difference between tax revenues and public sector expenditure. The term for this is The PSNCR: The Public Sector Net Cash Requirement. There were “only” 15 auctions of Gilts (UK Government Bonds) by the UK Debt Management Office to raise cash for HM Treasury:-
28-Oct-2020 0 3/8% Treasury Gilt £3,084.9990 Million
27-Oct-2020 0 1/8% Treasury Gilt 2024 £3,510.7420 Million
27-Oct-2020 1 5/8% Treasury Gilt 2071 £1,249.9990 Million
22-Oct-2020 0 5/8% Treasury Gilt 2035 £2,632.0000 Million
22-Oct-2020 0 5/8% Treasury Gilt 2050 £1,986.8750 Million
20-Oct-2020 1¼% Index-linked Treasury Gilt 2032 3 months £697.0490 Million
14-Oct-2020 0 7/8% Treasury Gilt 2029 £3,125.0000 Million
13-Oct-2020 0 1/8% Treasury Gilt 2026 £3,000.0000 Million
13-Oct-2020 1¾% Treasury Gilt 2057 £1,562.4990 Million
07-Oct-2020 0 3/8% Treasury Gilt 2030 £2,500.0000 Million
07-Oct-2020 0 1/8% Index-linked Treasury Gilt 2041 3 months £884.1490 Million
06-Oct-2020 0 1/8% Treasury Gilt 2024 £3,518.4520 Million
06-Oct-2020 1¾% Treasury Gilt 2049 £2,000.0000 Million
01-Oct-2020 0 1/8% Treasury Gilt 2023 £3,250.0000 Million
01-Oct-2020 1¼ % Treasury Gilt 2041 £2,000.0000 Million
(£3,084.9990 Million + £3,510.7420 Million + £1,249.9990 Million + £2,632.0000 Million + £1,986.8750 Million + £697.0490 Million + £3,125.0000 Million + £3,000.0000 Million + £1,562.4990 Million + £2,500.0000 Million + £884.1490 Million + £3,518.4520 Million + £2,000.0000 Million + £3,250.0000 Million + £2,000.0000 Million) = £35,001.764 Million
£35,001.764 Million = £35 Billion
On another way of looking at it, is in the 31 days in October 2020, HM Government borrowed:- £1129.089161 Million each day for the 31 days.
We are fortunate, while the global banking and financial markets still has the confidence in HM Government to buy the Gilts (Lend money to the UK), the budget deficit keeps rising. What is also alarming, is the dates these bond mature from 2023 through to 2071. All long term borrowings, we are mortgaging our futures, but at least “We Are In It Together….”
The Ascent of the Lithium Ion Battery Exchange Traded Fund – BATG
BATG is a London Listed Exchange Traded Fund (ETF)
https://www.londonstockexchange.com/stock/BATG/legal-and-general-asset-management/company-page
The graph speaks volumes.
Over 900p a share.

Investment in Good US Comedy
Bank of England November 2020 QE Programme
https://www.bankofengland.co.uk/monetary-policy-summary-and-minutes/2020/november-2020
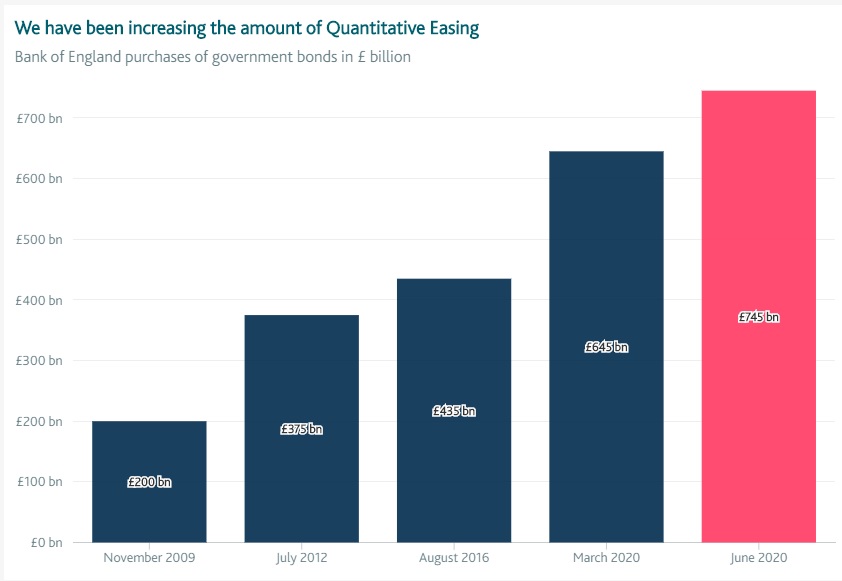
On Thursday 5th November, The Bank of England, extended its QE programme by an additional £150bn.
” The Committee voted unanimously for the Bank of England to continue with the existing programme of £100 billion of UK government bond purchases, financed by the issuance of central bank reserves, and also for the Bank of England to increase the target stock of purchased UK government bonds by an additional £150 billion, financed by the issuance of central bank reserves, to take the total stock of government bond purchases to £875 billion. “
Since the start of the financial crisis that began in 2008, the UK Central Bank, has created £875 billion of new money.
Now the QW programme was at £435bn in June 2016, and since Covid has jumped. It went up by £200bn when Covid19 hit in March.
https://www.bankofengland.co.uk/monetary-policy/quantitative-easing
and now jumped again:-
Robotics and Automation ETF
Milton Friedman Quote.
Inflation is taxation without legislation. Milton Friedman
The Long Term Investors

HM Government Borrowings: September 2020
Another month, guess what, take a lucky guess, it is the same old story, HM Government, spends more money than it receives via taxes and duties.
Now we are in a Covid 19 world. UK’s HM Government needs to fund many new demands. [www.dmo.gov.uk]
Another deficit month, thus to bridge the gap, needs to borrow on the bond market In September 2020 , the HM Government had to borrow money to meet the difference between tax revenues and public sector expenditure. The term for this is The PSNCR: The Public Sector Net Cash Requirement. There were “only” 11 auctions of Gilts (UK Government Bonds) by the UK Debt Management Office to raise cash for HM Treasury:-
29-Sep-2020 0 1/8% Treasury Gilt 2028 £3,437.4990 Million
24-Sep-2020 0 1/8% Treasury Gilt 2026 £3,749.9990 Million
24-Sep-2020 0 1/8% Index-linked Treasury Gilt 2028 3 months £1,310.7490 Million
16-Sep-2020 0 3/8% Treasury Gilt 2030 £3,124.9990 Million
15-Sep-2020 1¼% Treasury Gilt 2027 £2,867.5000 Million
15-Sep-2020 1¾% Treasury Gilt 2037 £2,187.5000 Million
10-Sep-2020 0 1/8% Treasury Gilt 2023 £3,250.0000 Million
10-Sep-2020 0 5/8% Treasury Gilt 2050 £2,421.7490 Million
03-Sep-2020 0 1/8% Treasury Gilt 2028 £3,412.7490 Million
03-Sep-2020 1¼ % Treasury Gilt 2041 £2,500.0000 Million
02-Sep-2020 0 1/8% Index-Linked Treasury Gilt 2056 3 months £459.0500 Million
= £3,437.4990 Million + £3,749.9990 Million + £1,310.7490 Million + £3,124.9990 Million + £2,867.5000 Million + £2,187.5000 Million + £3,250.0000 Million + £2,421.7490 Million + £3,412.7490 Million + £2,500.0000 Million + £459.0500 Million = £28,721.794 Million
£28,721.794 Million = £28.721 Billion
On another way of looking at it, is in the 30 days in September 2020, HM Government borrowed:- £957.3931333333333 Million each day for the 30 days.
We are fortunate, while the global banking and financial markets still has the confidence in HM Government to buy the Gilts (Lend money to the UK), the budget deficit keeps rising. What is also alarming, is the dates these bond mature from 2023 through to 2056. All long term borrowings, we are mortgaging our futures, but at least “We Are In It Together….”
BP’s Quarterly Results.
The oil major BP had some interesting results in the Q2 figures.
A huge oil and gas company that is transitioning into Green energy.
Its balance sheet on page 17 has some very interesting figures:
Cash position £34.217 Billion.
It has a pension surplus, in its Defined benefit pension plan of £6.346 Billion
Page 27 has some interesting Deb figures:
Finance debt £76.003 Billion
Gearing of 33.1%.
Investment in Comedy
The Gresham House Energy Storage Fund September 2020 Dividend
The Gresham House Energy Storage Fund paid out its September dividend on the 30th Sept.
It was 1.75p a share
https://www.londonstockexchange.com/news-article/GRID/total-voting-rights/14483969
The Company’s issued share capital consisted of 234,270,650 Ordinary Shares.
thus:-
234,270,650 x £0.0175 = £4,099,736.375
https://www.hl.co.uk/shares/shares-search-results/g/gresham-house-energy-storage-ord-gbp0.01
A yield of 4.01%
The Father of Index Funds
Graphs of the Covid19 Dip in the Stockmarket


The Investment in Bold Bets. Your Calling
Legal and General Cyber Security ETF
Standard Life Aberdeen PLC September dividend
Standard Life Aberdeen paid out its September dividend on the 30th Sept.
https://www.standardlifeaberdeen.com/
It was 7.3p a share
https://www.lse.co.uk/rns/SLA/total-voting-rights-w5s1goqtue7qnsu.html
The total number of voting rights in the Company, as at 30 September 2020, is therefore 2,225,782,374
thus:-
2,225,782,374 x £0.073 = 162,482,113.302
https://www.hl.co.uk/shares/shares-search-results/s/standard-life-aberdeen-plc-ordinary-13-616
A yield of 9%
Legal and General Battery ETF
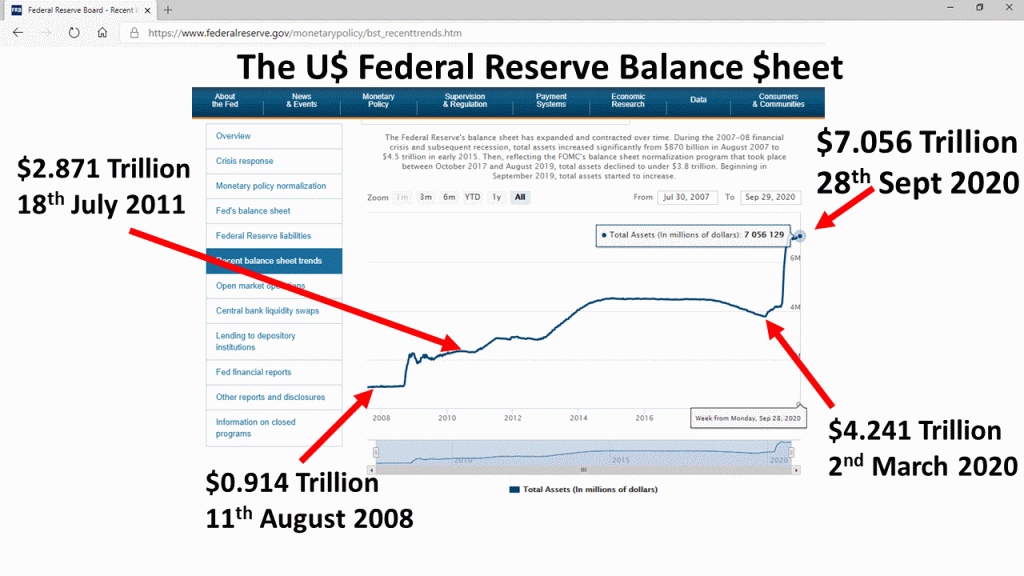
The US Federal Reserve Balance Sheet
A picture paints a thousand words. The most highly regarded and respected financial institution in the world is arguably is the United States central bank, the US Federal Reserve, affectionately known as The Fed. It’s current chairman is Jerome Powell, the former chair persons, all have vast intellectual capacity, famous name such as Janet Yellan, Ben Bernanke, Alan Greenspan, Paul Volcker people of incredible calibre and wisdom. Since 2008 the world has had huge financial turmoil, from the 2008 global financial crisis to the now terrible impact of Covid19 on the global economy. What is very interesting to observe is shear scale of the financial intervention into the markets that The Fed has undertaken, effectively injecting huge quantities of cash (liquidity) into the market, to buy assets off commercial banks, to keep markets functioning. A good way to see that scale of intervention is to look at the movement in size of The Fed’s balance sheet.https://www.federalreserve.gov/monetarypolicy/bst_recenttrends.htm From 2008, just before the financial crisis hit, the assets on the US Federal Reserve were $914,632 Million = $914 Billion = $0.914 Trillion dollars. Then the credit crisis hits and then the Fed intervened into the market by buying mortgage securities and also buying US Treasuries (US Government bonds = US Government Debt) what we know as Quantitative Easing (QE). Then the balance sheet jumped to $2,871,301 Million = £2,871 Billion = $2.871 Trillion dollars, and then by March this year that grown to $4,241,507 Million = $4,241 Billion = $4.241 Trillion dollars just before Covid19 hits, and then the acceleration in the size of the balance sheet, rockets to now where it stands at $7,056,129 Million = $7,056 Billion = $7.056 Trillion. Its scale can not be under-estimated, the fire power of the US Federal Reserve is vast. However what we are seeing is a huge scale market intervention from the central bank to ensure market stability by pumping massive quantities of cash into the system by asset purchases, and then question becomes, are asset prices rising because of the level of national debt, globally, as we are seeing soaring equity prices and perhaps inflation is on the horizon that will wipe out the value of our cash savings.
Investment in Multiple Languages
The Renewables Infrastructure Group Sept 2020 dividend
The Renewables Infrastructure Group paid out its September dividend on the 30th Sept.
It was 1.69p a share
https://www.londonstockexchange.com/news-article/TRIG/total-voting-rights/14704386
The total issued share capital with voting rights is 1,741,925,855.
thus:-
1,741,925,855 x £0.0169 = £29,438,546.9495
A yield of 4.86%
Investment in Quantum Mechanics
The beauty of a superfluid. Liquid Helium.
Buffet quote
I never attempt to make money on the stock market. I buy on the assumption that they could close the market the next day and not reopen it for ten years. Warren Buffett
The total Debt of Astra Zeneca
Astra Zeneca is the UK’s largest company. The pharma giant.
It carries debt as a part of its funding strategy.
https://www.astrazeneca.com/investor-relations/debt-investors.html
Currency Notional (m) Issue date Maturity date Coupon Frequency ISIN
USD 1,600 16-Nov-15 16-Nov-20 2.375% Semi-annual US046353AK44
EUR 500 12-May-16 12-May-21 0.25% Annual XS1411403709
EUR 750 24-Nov-14 24-Nov-21 0.875% Annual XS1143486865
USD 250 12-Jun-17 10-Jun-22 3m Libor + 0.62% Quarterly US046353ap31
USD 1,000 12-Jun-17 12-Jun-22 2.375% Semi-annual US046353AQ14
USD 850 17-Aug-18 17-Aug-23 3.50% Semi-annual US046353AR96
USD 400 17-Aug-18 17-Aug-23 3m Libor + 0.665% Quarterly US046353AS79
USD 287 15-Nov-93 15-Nov-23 7.00% Semi-annual US98934KAB61
EUR 900 12-May-16 12-May-24 0.75% Annual XS1411404855
USD 2,000 16-Nov-15 16-Nov-25 3.375% Semi-annual US046353AL27
USD 1,200 06-Aug-20 08-Apr-26 0.70% Semi-annual US046353AV09
USD 750 12-Jun-17 12-Jun-27 3.125% Semi-annual US046353AN82
EUR 800 12-May-16 12-May-28 1.25% Annual XS1411404426
USD 1,000 17-Aug-18 17-Jan-29 4.00% Semi-annual US046353AT52
USD 1,300 06-Aug-20 06-Aug-30 1.375% Semi-annual US046353AW81
GBP 350 13-Nov-07 13-Nov-31 5.75% Annual XS0330497149
USD 2,750 12-Sep-07 15-Sep-37 6.45% Semi-annual US046353AD01
USD 1,000 18-Sep-12 18-Sep-42 4.00% Semi-annual US046353AG32
USD 1,000 16-Nov-15 16-Nov-45 4.375% Semi-annual US046353AM00
USD 750 17-Aug-18 17-Aug-48 4.375% Semi-annual US046353AU26
USD 500 06-Aug-20 06-Aug-50 2.125% Semi-annual US046353AX64
That is:-
£350m
€2950m
$16,637m
That is in UK £ = 16,019m
Ice on Fire: HBO
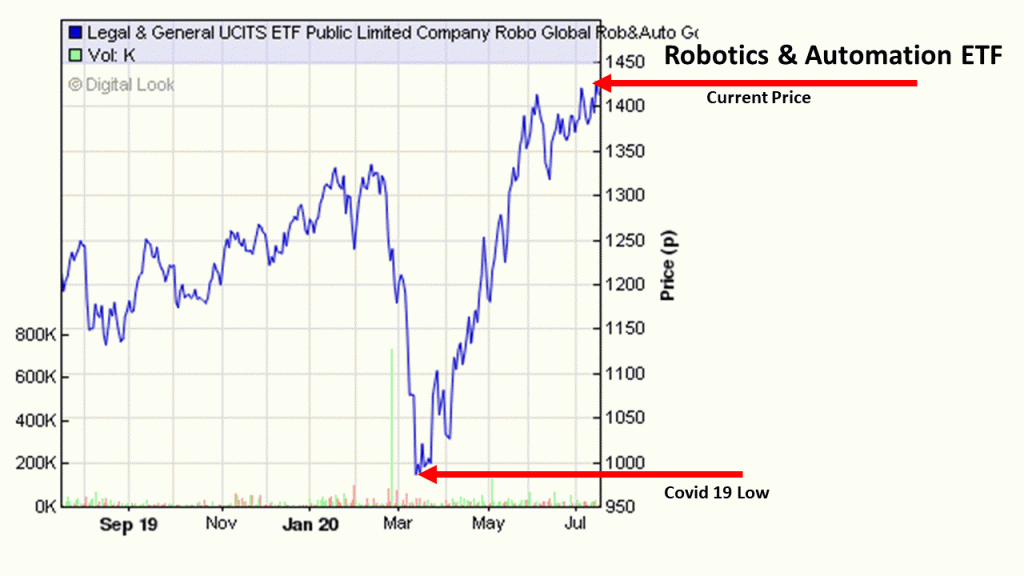
Robotics and Automation
https://www.londonstockexchange.com/stock/ROBG/legal-and-general-asset-management/company-page
And lets not forget the dangers and risks…..of Robotics and Automation…..

HM Government Borrowings: August 2020
Another month, guess what, take a lucky guess, it is the same old story, HM Government, spends more money than it receives via taxes and duties.
Now we are in a Covid 19 world. UK’s HM Government needs to fund many new demands.
Another deficit month, thus to bridge the gap, needs to borrow on the bond market In August 2020 , the HM Government had to borrow money to meet the difference between tax revenues and public sector expenditure. The term for this is The PSNCR: The Public Sector Net Cash Requirement. There were “only” 14 auctions of Gilts (UK Government Bonds) by the UK Debt Management Office to raise cash for HM Treasury:-
26-Aug-2020 0 3/8% Treasury Gilt 2030 2,750.0000 Million
25-Aug-2020 0 1/8% Treasury Gilt 2026 3,000.0000 Million
25-Aug-2020 1 5/8% Treasury Gilt 2054 1,342.3750 Million
20-Aug-2020 0 1/8% Index-linked Treasury Gilt 2028 3 months 1,374.9990 Million
19-Aug-2020 0 7/8% Treasury Gilt 2029 3,437.5000 Million
18-Aug-2020 0 1/8% Treasury Gilt 2023 4,062.4970 Million
18-Aug-2020 0 5/8% Treasury Gilt 2050 2,477.2500 Million
12-Aug-2020 0 1/8% Treasury Gilt 2028 3,437.4990 Million
11-Aug-2020 0 5/8% Treasury Gilt 2025 3,250.0000 Million
11-Aug-2020 1¾% Treasury Gilt 2057 1,250.0000 Million
05-Aug-2020 0 1/8% Index-linked Treasury Gilt 2048 3 months 562.2500 Million
05-Aug-2020 0 3/8% Treasury Gilt 2030 2,750.0000 Million
04-Aug-2020 0 1/8% Treasury Gilt 2026 4,062.4990 Million
04-Aug-2020 1¼ % Treasury Gilt 2041 2,812.4990 Million
Thus:
2,750.0000 Million+3,000.0000 Million+1,342.3750 Million+1,374.9990 Million+3,437.5000 Million+4,062.4970 Million+2,477.2500 Million+3,437.4990 Million+3,250.0000 Million+1,250.0000 Million+562.2500 Million+2,750.0000 Million+4,062.4990 Million+2,812.4990 Million = £36569.368 Million
That is £36.569368 Billion
On another way of looking at it, is in the 31 days in August 2020, HM Government borrowed:- £1.179657032 Billion each day for the 31 days.
We are fortunate, while the global banking and financial markets still has the confidence in HM Government to buy the Gilts (Lend money to the UK), the budget deficit keeps rising. What is also alarming, is the dates these bond mature from 2023 through to 2057. All long term borrowings, we are mortgaging our futures, but at least “We Are In It Together….”
Royal Dutch Shell September Dividend.
Today, Royal Dutch Shell pays out its quarterly dividend.
it is 12.09p a share.
Shell PLC is a dual listed company
https://www.londonstockexchange.com/stock/RDSA/royal-dutch-shell-plc/company-page
and
https://www.londonstockexchange.com/stock/RDSB/royal-dutch-shell-plc/company-page
Royal Dutch Shell plc’s capital as at 31 August 2020, consists of 4,101,239,499 A shares and 3,706,183,836 B shares, each with equal voting rights. Royal Dutch Shell plc holds no ordinary shares in Treasury.
https://www.londonstockexchange.com/news-article/RDSA/voting-rights-and-capital/14671798
Thus:
4,101,239,499 A shares x 12.09p = £495,839,855.4291
+
3,706,183,836 B shares x 12.09p = £448,077,625.7724
Thus
[£495,839,855.4291]+[£448,077,625.7724]= £943,917,481.2015
That is £943million of cash
LGIM (Legal & General Investment Management) Talks
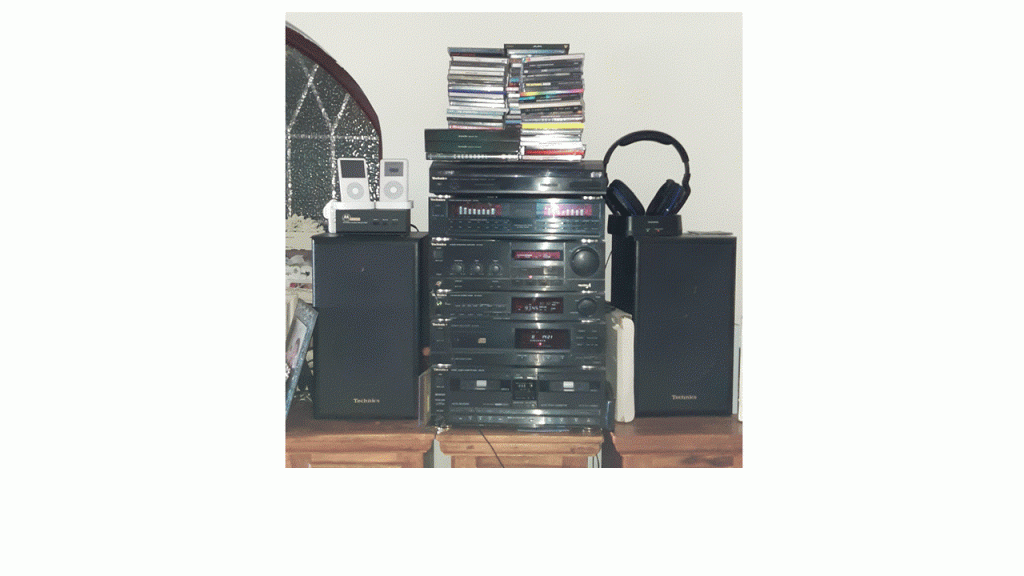
Technics
Investment in “Shadow Play”
Investment in The Law.
A New York Minute
Ray Dalio on Money Printing
Norway’s wealth fund loses £16bn in first half of 2020 after Covid panic
Norway’s sovereign wealth fund – the world’s largest – made a £16bn loss in the first half of the year and warned that financial markets could face further volatility as the Covid pandemic was still out of control.
The £895bn fund said it suffered a 3.4% drop in returns in the first six months of 2020, equivalent to a 188bn kroner (£16bn) decline, when its investments were hit by the early-March market sell-off sparked by panic about the coronavirus outbreak.
While investor confidence had been restored by “massive” state support packages, the fund’s deputy chief executive, Trond Grande, said financial markets were not reflecting the real economic impact of the virus, which he said was not under control “in any shape or form”.
He said: “We have already seen some sort of V-shaped recovery in the financial markets. I think there is a slight disconnect between the real economy and the financial markets.”
He also warned that there could be further market volatility, particularly if there was a surge in coronavirus cases later this year.
“We could be in for some turbulence this fall as things unfold and whether or not the coronavirus pandemic recedes, or gains some force,” Grande said, and the full impact on sectors such as travel and leisure was yet to be seen.
The fund’s deputy also noted that state support for national economies may not be sustainable long-term.
A further drop in share prices would cause further pain for the sovereign wealth fund, which was founded in 1996 and invests the country’s oil revenues abroad to shield its economy from market turmoil. The fund owns nearly 1.5% of all globally listed shares, with stakes in over 9,000 companies.
The Norwegian fund’s shareholdings in oil and gas companies suffered the biggest declines in the first six months of 2020. The stocks lost 33.1% of their value as oil prices plunged amid coronavirus travel restrictions, which dramatically reduced demand.
Its bank investments also performed poorly, with financial stocks declining nearly 21% over in first six months of the year. Lender profits were hit by lower interest rates and provisions for future defaults on loans, as a number of countries plunged into economic recessions due to Covid-19. Norway’s returns were also impacted by a drop in shareholder payouts, after regulators pressure banks to either scrap or reduce dividends at the start of the year.
The worst performers in its portfolio included Royal Dutch Shell, HSBC and JP Morgan.
Amazon was one of the strongest performers, alongside Microsoft and Apple. Overall, the tech sector delivered a 14.2% return for the fund thanks to strong demand for online services around remote working, education, shopping and entertainment during the pandemic.
The UK – which accounts for the fund’s largest equity holdings at 6.9% – was the worst regional performers, after the fund’s share of London-listed stocks losing 24.3% of their value over the period.
It comes after the UK reported a 20.4% drop in gross domestic product in the second quarter, which was the worst of any G7 nation in the three months to June. It also marked the deepest recession since records began.
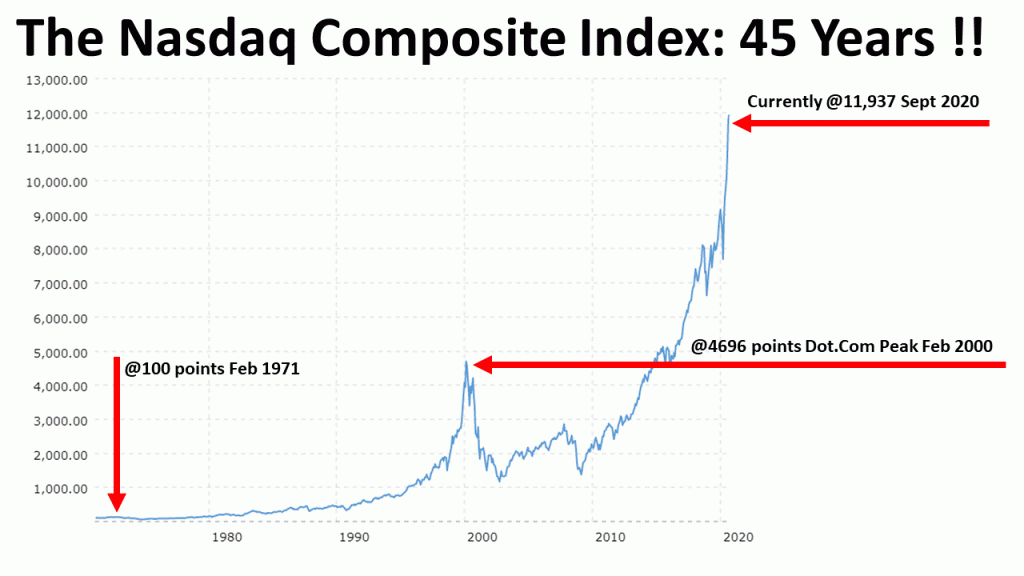
The Ascent of the Nasdaq
The “Tech Heavy” Nasdaq index started in Feb 1971 at 100 Points. Today it is over 11,000+ points.
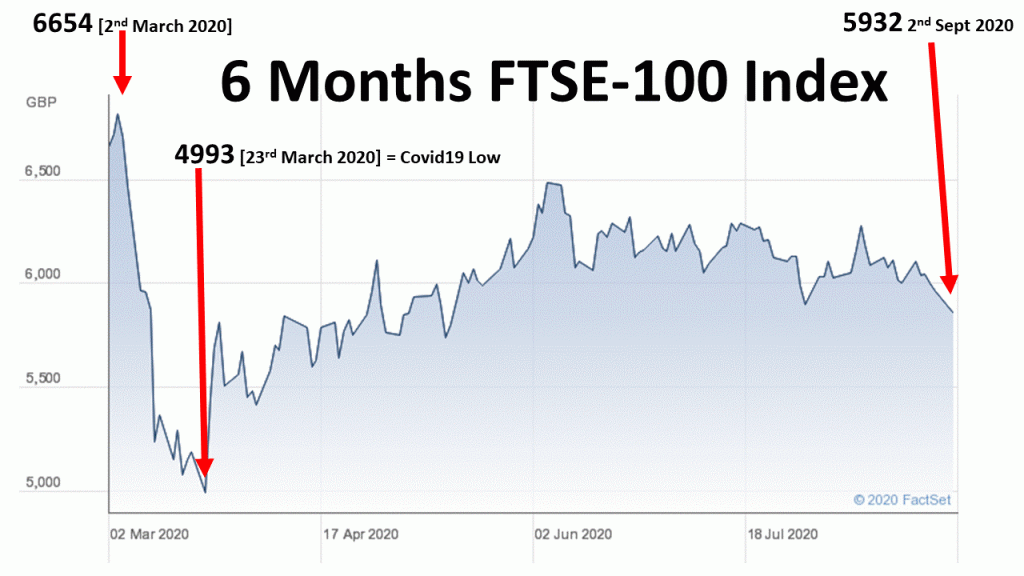
6 Months of the the FTSE-100 Index
Wise Quote from Warren Buffet
Do not save what is left after spending, but spend what is left after saving.
Warren Buffet
Read more: https://www.wiseoldsayings.com/investment-quotes/#ixzz6Unv1G0MT
The Knowledge of Paul Krugman
The Legal and General Global Technology Index Trust
The Legal and General Global Technology Index Trust is an index fund managed by Legal and General. It aims to provide growth by tracking the performance of the FTSE World-Technology Index.
Its top ten holdings are:-
Apple Inc 15.5% of the fund
Microsoft Corp 15.5% of the fund
Alphabet Cl A 4.6% of the fund
Alphabet Cl C 4.4% of the fund
Facebook 4.4% of the fund
Taiwan Semiconductor Manufacturing 2.7% of the fund
Intel Corp 2.7% of the fund
Nvidia Corp 2.4% of the fund
Adobe Inc 2.2% of the fund
Samsung Electronics Co Ltd 2.2% of the fund
It is £807.3m fund.
United States is where 80.5% of the assets are held.
Greencoat UK Wind August 2020 Dividend
Tomorrow, Greencoat UK Wind pays out is dividend.
https://www.greencoat-ukwind.com/
1.775p a share
the total voting rights figure will be 1,518,162,889
Thus:
1,518,162,889 x 0.01775 = £26,947,391.27975
That is £26million
http://www.shareshop.hsbc.co.uk/shareshop/security.cgi?csi=7013076&action=
4.8% yield.
HM Government Borrowing: July 2020
Another month, guess what, take a lucky guess, it is the same old story, HM Government, spends more money than it receives via taxes and duties.
Now we are in a Covid 19 world. UK’s HM Government needs to fund many new demands.
Another deficit month, thus to bridge the gap, needs to borrow on the bond market In March 2020 , the HM Government had to borrow money to meet the difference between tax revenues and public sector expenditure. The term for this is The PSNCR: The Public Sector Net Cash Requirement. There were “only” 19 auctions of Gilts (UK Government Bonds) by the UK Debt Management Office to raise cash for HM Treasury:-
29-Jul-2020 0 1/8% Treasury Gilt 2023 £3,500.0000 Million
29-Jul-2020 1 5/8% Treasury Gilt 2028 £3,008.8750 Million
28-Jul-2020 1 5/8% Treasury Gilt 2054 £1,874.9990 Million
28-Jul-2020 1¼% Treasury Gilt 2027 £3,437.4990 Million
22-Jul-2020 0 1/8% Treasury Gilt 2028 £3,000.0000 Million
22-Jul-2020 1¼% Index-linked Treasury Gilt 2032 £500.0000 Million
21-Jul-2020 0 5/8% Treasury Gilt 2050 £2,711.0000 Million
21-Jul-2020 1½% Treasury Gilt 2026 £3,749.9990 Million
15-Jul-2020 1¾% Treasury Gilt 2057 £1,500.0000 Million
15-Jul-2020 2¼% Treasury Gilt 2023 £3,250.0000 Million
14-Jul-2020 0 1/8% Treasury Gilt 2026 £3,834.0950 Million
14-Jul-2020 0 3/8% Treasury Gilt 2030 £3,750.0000 Million
09-Jul-2020 0 1/8% Index-linked Treasury Gilt 2041 £1,062.8500 Million
07-Jul-2020 0 1/8% Treasury Gilt 2023 £3,750.0000 Million
07-Jul-2020 1¼ % Treasury Gilt 2041 £2,812.500 Million
02-Jul-2020 0 5/8% Treasury Gilt 2025 £4,261.1950 Million
02-Jul-2020 4½% Treasury Gilt 2034 £2,329.2500 Million
01-Jul-2020 0 1/8% Treasury Gilt 2028 £3,000.0000 Million
01-Jul-2020 0 5/8% Treasury Gilt 2050 £2,785.9990 Million
Add:- (£3,500.0000 + £3,008.8750 + £1,874.9990 + £3,437.4990 + £3,000.0000 + £500.0000 +£2,711.0000 +£3,749.9990 + £1,500.0000 + £3,250.0000 + £3,834.0950 + £3,750.0000 + £1,062.8500 + £3,750.0000 + £2,812.500 + £4,261.1950 + £2,329.2500 + £3,000.0000 + £2,785.9990) Million = £54,118.261 Million
£54,118.261 Million = £54.11261 Billion
On another way of looking at it, is in the 31 days in July 2020, HM Government borrowed:- £1,745.75 Billion each day for the 31 days.
We are fortunate, while the global banking and financial markets still has the confidence in HM Government to buy the Gilts (Lend money to the UK), the budget deficit keeps rising. What is also alarming, is the dates these bond mature from 2023 through to 2057. All long term borrowings, we are mortgaging our futures, but at least “We Are In It Together….”
Warren Buffett Bets on…Berkshire Hathaway
The Octopus Renewables Infrastructure Trust
Today, The Octopus Renewables Infrastructure Trust pays out its August dividend.
https://octopusrenewablesinfrastructure.com/
1.06p a share.
Total number of voting rights of The Octopus Renewables Infrastructure Trust is 350,000,000
Thus:
350,000,000 x £0.0106 = £3,710,000
£3.7million
http://www.shareshop.hsbc.co.uk/shareshop/security.cgi?csi=55025967
Ray Dalio: Inflation Is Coming
The Recovery Trajectory: Allianz’s El-Erian
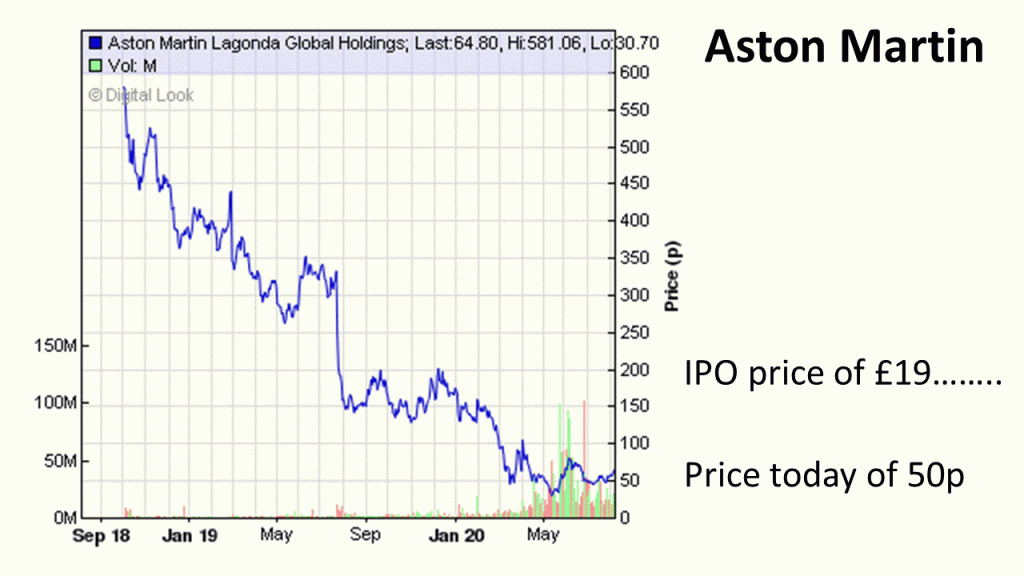
Wealth Destruction at Aston Martin
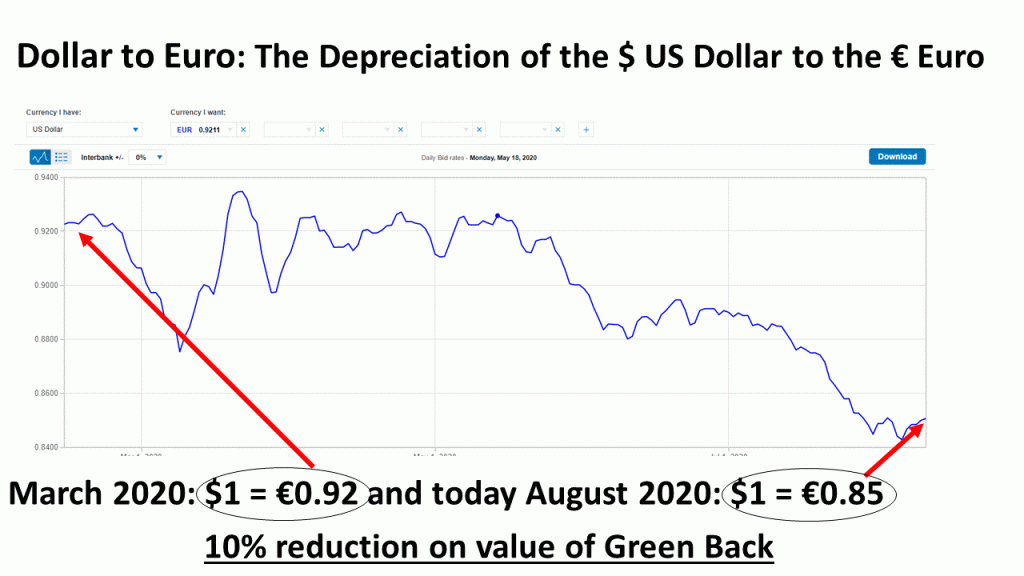
The Depreciation of the $ US Dollar to the € Euro
Vodafone August 2020 Dividend
On Friday 7th August 2020, Vodafone PLC paid out its August 2020 dividend.
www.vodafone.com
€0.045 a share = 4.079745p a share.
https://otp.tools.investis.com/clients/uk/vodafone4/rns/regulatory-story.aspx?cid=221&newsid=1405715
Therefore, the total number of voting rights in Vodafone is 26,824,338,960
Thus:-
26,824,338,960 x £0.04079745 = £1,094,364,627.503652
That is £1.094 Billion.
7% yield
The Foreign and Colonial Investment Trust PLC: August Dividend
On the 3rd of August 2020, The Foreign and Colonial Investment Trust PLC paid out its August dividend.
One of the world’s oldest investment trusts, F&C Investment Trust (FCIT) is a behemoth,with almost £4bn in AUM. The company, over 150 years old.
It paid out 2.9p a share.
Therefore, the total number of voting rights in the Company is now 541,189,043
Thus:
541,189,043 x £0.029 = 15,694,482.247
That is £15m
http://www.shareshop.hsbc.co.uk/shareshop/security.cgi?csi=10192&action=
The Legal and General Future World Multi-Index 4 Fund
The Legal and General Future World Multi-Index 4 Fund, is a fund that invests in a risk-profile targeted range of index tracker funds and individual investments including property. Typically has higher exposure to bonds than to shares in companies.
| North America Equity | 13.3% | |
| UK Equity | 9.2% | |
| Europe ex UK Equity | 6.9% | |
| Japan Equity | 4.8% | |
| Emerging Market Equity | 2.4% | |
| Asia Pacific ex Japan Equity | 2.1% |
TOP 10 HOLDINGS (%)
L&G Future World ESG Developed Fund 20.0% of the fund
L&G Future World Global Credit Fund 16.7% of the fund
L&G Short Dated Sterling Corporate Bond Index Fund 11.0% of the fund
L&G Global Inflation Linked Bond Index Fund 7.8% of the fund
L&G Future World ESG UK Fund 7.1% of the fund
L&G ESG EM Gov Bond USD Fund 4.9% of the fund
LGIM GBP Liquidity Fund Plus 4.9% of the fund
Europe ex UK Equity 3.5% of the fund
L&G High Income Trust 3.4% of the fund
L&G Japan Equity UCITS ETF 3.0% of the fund
https://literature-lgim.huguenots.co.uk/srp/documents/?type=FS&ISIN=GB00BJ0M3438
From “The Way Forward” Conference: Ray Dalio Founder, Co-Chairman and Co-CIO, Bridgewater Associates
United Utilities August 2020 Dividend.
Today, 3rd August, United Utilities pays out its August 2020 dividend.
28.4p a share.
the total voting rights in United Utilities is 681,888,418 shares.
Thus:
681,888,418 x £0.284 = £193,656,310.712
That is £193 Million.
http://www.shareshop.hsbc.co.uk/shareshop/security.cgi?csi=10096
4.9% yield
Charles Dickens Money Quote
“Annual income twenty pounds, annual expenditure nineteen six, result happiness. Annual income twenty pounds, annual expenditure twenty pound ought and six, result misery.” – Charles Dickens
Bill Gates: Covid 19 on TED
Legal & General UCITS ETF Public Limited Company Robo Global Rob&Auto Go UCITS ETF
Negative Interest Rates: Mechanisms
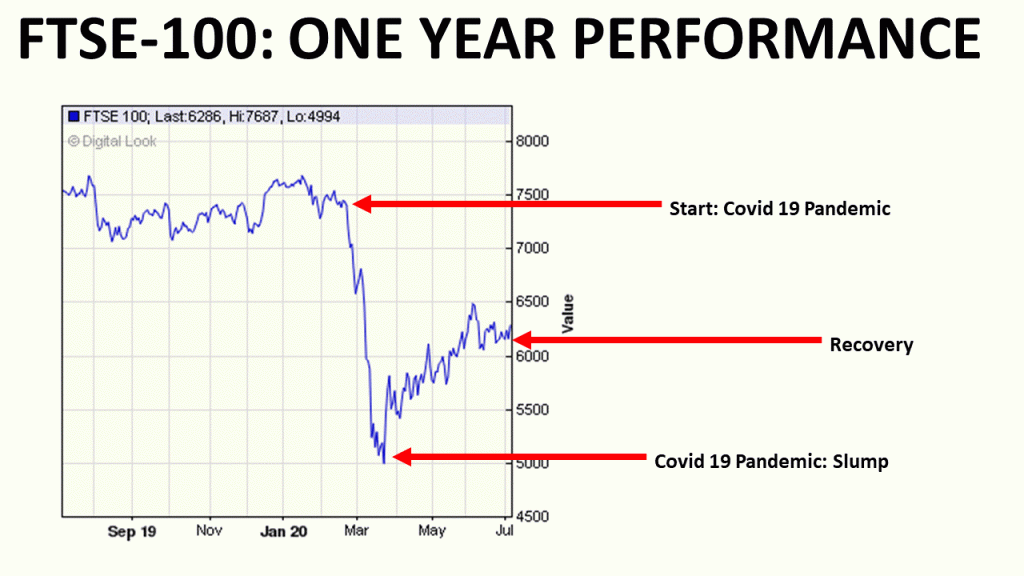
FTSE100: The Covid 19 Effect
Britain’s Most Valuable Company: Astra Zeneca
Today, Astra Zeneca PLC is the most valuable company listed on the LondonStockExchange.
A world-leading pharmaceutical group, AstraZeneca was created in 1999 via the merger of Sweden’s Astra and the UK’s Zeneca, which had been demerged from chemicals group ICI in 1993.
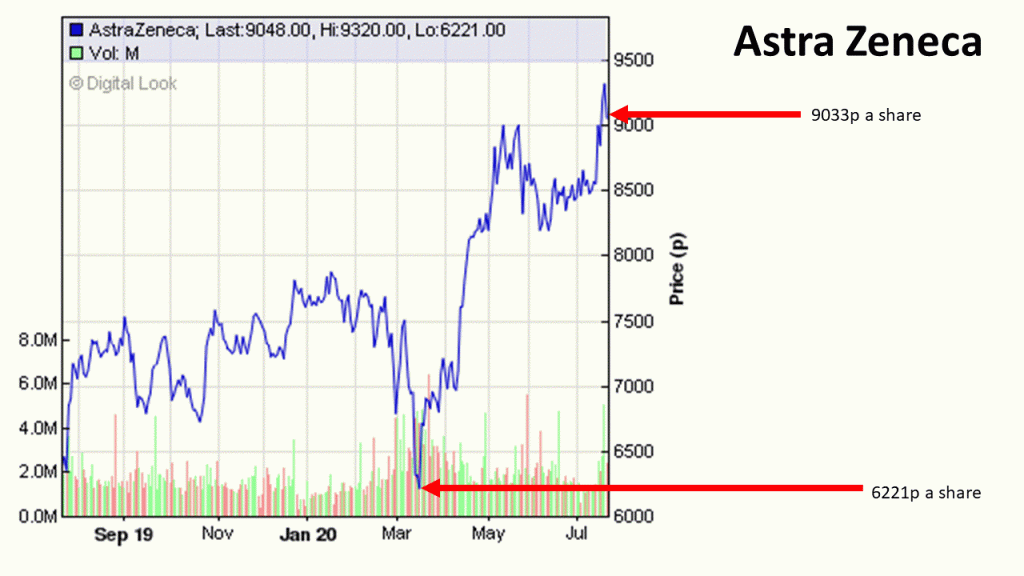
Its low this year was £62.21 a share and is now at nearly £90 a share.
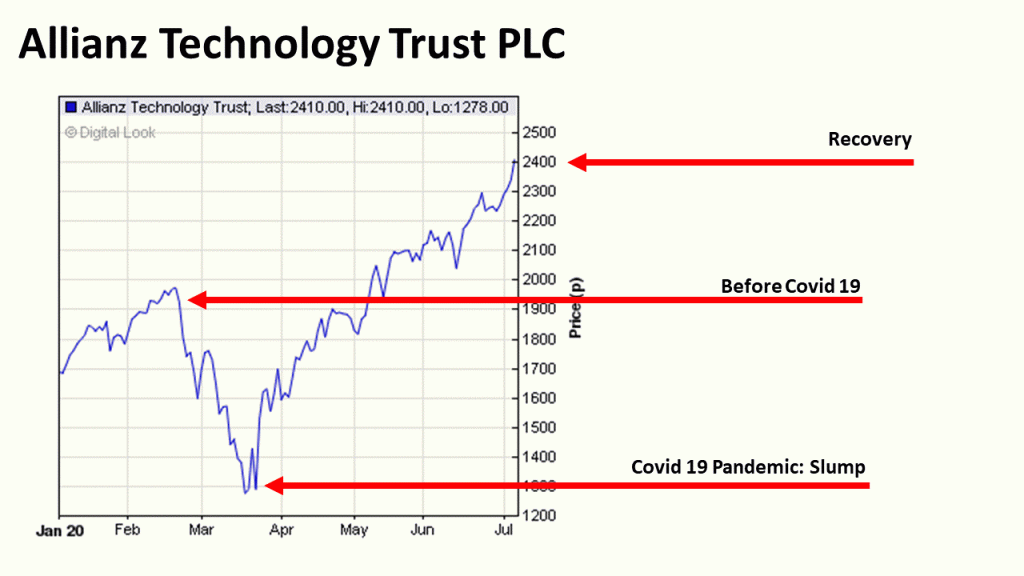
The Ascent of The Allianz Technology Trust PLC
Government Funding: National Savings and Investments.
HM Government has asked National Savings & Investments to “get more cash” into The Treasury.
HM Treasury has today confirmed that NS&I’s Net Financing target for 2020-21 has been revised from £6 billion (+/- £3 billion) to £35 billion (+/- £5 billion) to reflect government finance requirements arising from Covid-19.
NS&I’s Annual Report & Accounts 2019-20, published on 23 June 2020, stated that NS&I’s £6 billion Net Financing target announced in the March 2020 Budget would be subject to in-year revision. Today’s new target may be subject to further revision during the year, depending on the government finance requirement.
the jump is the £6bn to £35bn. HM Treasury looking at all avenues to raise revenue / income into the government to fund the massive budget deficit.
Dr Doom: Nouriel Roubini
HM Government Borrowing: June 2020
Another month, guess what, take a lucky guess, it is the same old story, HM Government, spends more money than it receives via taxes and duties.
Another deficit month, thus to bridge the gap, needs to borrow on the bond market In June 2020 , the HM Government had to borrow money to meet the difference between tax revenues and public sector expenditure and deal with the economic damage from Covid19. The term for this is The PSNCR: The Public Sector Net Cash Requirement. There were “only” 16 auctions of Gilts (UK Government Bonds) by the UK Debt Management Office to raise cash for HM Treasury:-
25-Jun-2020 0 1/8% Index-linked Treasury Gilt 2029 3 months £1,229.5760
24-Jun-2020 1 5/8% Treasury Gilt 2054 £1,768.2500 Million
24-Jun-2020 2¾% Treasury Gilt 2024 £3,250.0000 Million
23-Jun-2020 0 1/8% Treasury Gilt 2026 £3,250.0000 Million
23-Jun-2020 0 3/8% Treasury Gilt 2030 £3,628.7500 Million
17-Jun-2020 0 1/8% Treasury Gilt 2023 £4,260.7490 Million
17-Jun-2020 1¼ % Treasury Gilt 2041 £2,812.5000 Million
16-Jun-2020 1½% Treasury Gilt 2026 £3,716.2500 Million
16-Jun-2020 4¾% Treasury Gilt 2030 £2,000.0000 Million
11-Jun-2020 0 1/8% Treasury Gilt 2028 £4,036.6240 Million
11-Jun-2020 1% Treasury Gilt 2024 £3,250.0000 Million
10-Jun-2020 0 1/8% Index-linked Treasury Gilt 2036 £900.0000 Million
03-Jun-2020 1 5/8% Treasury Gilt 2054 £1,500.0000 Million
03-Jun-2020 2¼% Treasury Gilt 2023 £3,941.2490 Million
02-Jun-2020 0 1/8% Treasury Gilt 2026 £3,328.7500 Million
02-Jun-2020 0 3/8% Treasury Gilt 2030 £3,749.9990 Million
When you add the cash raised:-
1,229.58 Million + 1,768.25 Million + 3,250.00 Million + 3,250.00 Million + 3,628.75 Million + 4,260.75 Million + 2,812.50 Million + 3,716.25 Million + 2,000.00 Million + 4,036.62 Million + 3,250.00 Million + 900.00 Million + 1,500.00 Million + 3,941.25 Million + 3,328.75 Million + 3,750.00 = £46,622.697 Million
£46,622.697 Million = £46.622 Billion
On another way of looking at it, is in the 30 days in June 2020, HM Government borrowed:- £1,554.0899 Million each day for the 30 days.
We are fortunate, while the global banking and financial markets still has the confidence in HM Government to buy the Gilts (Lend money to the UK), the budget deficit keeps rising. What is also alarming, is the dates these bond mature from 2024 through to 2057. All long term borrowings, we are mortgaging our futures, but at least “We Are In It Together….”
Ray Dalio on the Economy, Pandemic, China’s Rise
The Investment in Ramanujan: The Meaning of Ramanujan and His Lost Notebook
The Renewables Infrastructure Group.
On Tuesday 30th June, The Renewables Infrastructure Group paid its shareholders its June 2020 dividend.
1.69p a share
The total issued share capital with voting rights is 1,637,453,267.
https://www.londonstockexchange.com/news-article/TRIG/total-voting-rights/14485497
Thus:
1,637,453,267 x £0.0169 = 27,672,960.2123
That is £27.672million
http://www.shareshop.hsbc.co.uk/shareshop/security.cgi?csi=11834937&action=
5.3% yield
HICL Infrastructure
On Tuesday 30th June, HICL Infrastructure paid to its shareholders its June 2020 dividend
£0.0207 a share.
he total issued share capital with voting rights is 1,863,642,769
https://otp.tools.investis.com/clients/uk/hicl/rns/regulatory-story.aspx?cid=1239&newsid=1362209
Thus:
1,863,642,769 x £0.0207 = 38,577,405.3183
That is £38.577 Million
http://www.shareshop.hsbc.co.uk/shareshop/security.cgi?csi=185903&action=
4.7% yield
The Investment in 0.577
$7 Trillion Dollar Balance Sheet : The US Federal Reserve.
The US Central Bank is the US Federal Reserve https://www.federalreserve.gov/
Its balance sheet is huge:
https://www.federalreserve.gov/releases/h41/current/h41.htm
Total assets: $7,168,936 MILLION
That is $7.1 TRILLION Dollar$
There’s a great disconnect between fundamentals and finance
Investment in Innovation
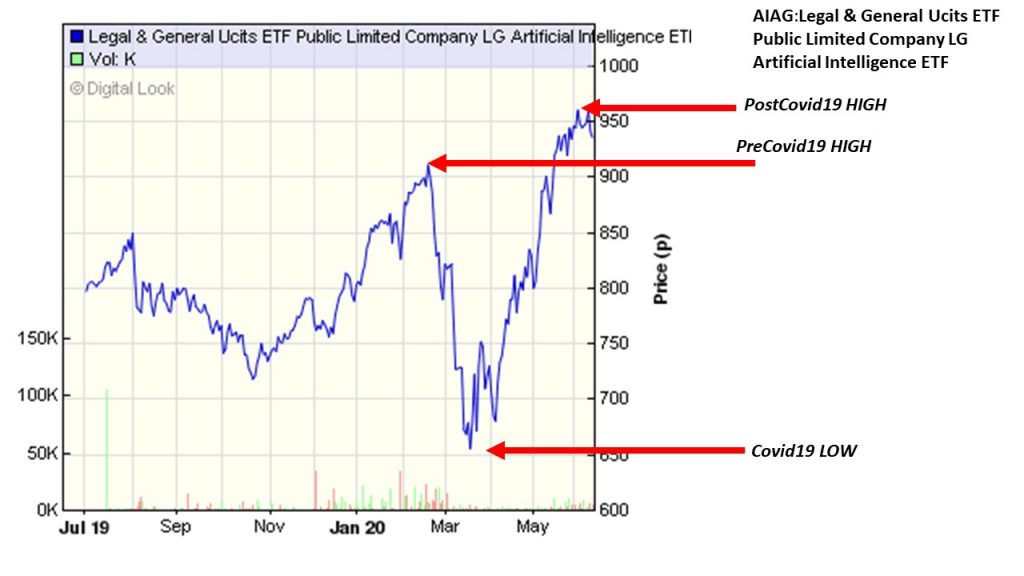
AIAG:Legal & General Ucits ETF Public Limited Company LG Artificial Intelligence ETF
The Legal & General Ucits ETF Public Limited Company LG Artificial Intelligence ETF invests in companies that are pioneering Artificial Intelligence.
http://www.shareshop.hsbc.co.uk/shareshop/security.cgi?csi=54852988&action=
Its performance is remarkable.
The Shell June 2020 Dividend.
Royal Dutch Shell, paid out Mon 22nd June its reduced June quarterly dividend.
www.shell.com
RDSA Royal Dutch Shell A FTSE 100 $0.16 (12.68p) 22-Jun
RDSB Royal Dutch Shell B FTSE 100 $0.16 (12.68p) 22-Jun
https://www.londonstockexchange.com/news-article/RDSA/voting-rights-and-capital/14558429
Royal Dutch Shell plc’s capital as at 29 May 2020, consists of 4,101,239,499 A shares and 3,706,183,836 B shares, each with equal voting rights. Royal Dutch Shell plc holds no ordinary shares in Treasury. The total number of A shares and B shares in issue as at 29 May 2020 is 7,807,423,335
Thus
4,101,239,499 A shares x 12.68p = £520,037,168.4732
3,706,183,836 B shares x 12.68p = £469,944,110.4048
(£520,037,168.4732)+(£469,944,110.4048) = £989,981,278.878
That is £989million of cash
http://www.shareshop.hsbc.co.uk/shareshop/security.cgi?csi=133655
Shell A 11% yield
http://www.shareshop.hsbc.co.uk/shareshop/security.cgi?csi=133755
Shell B 11% yield.
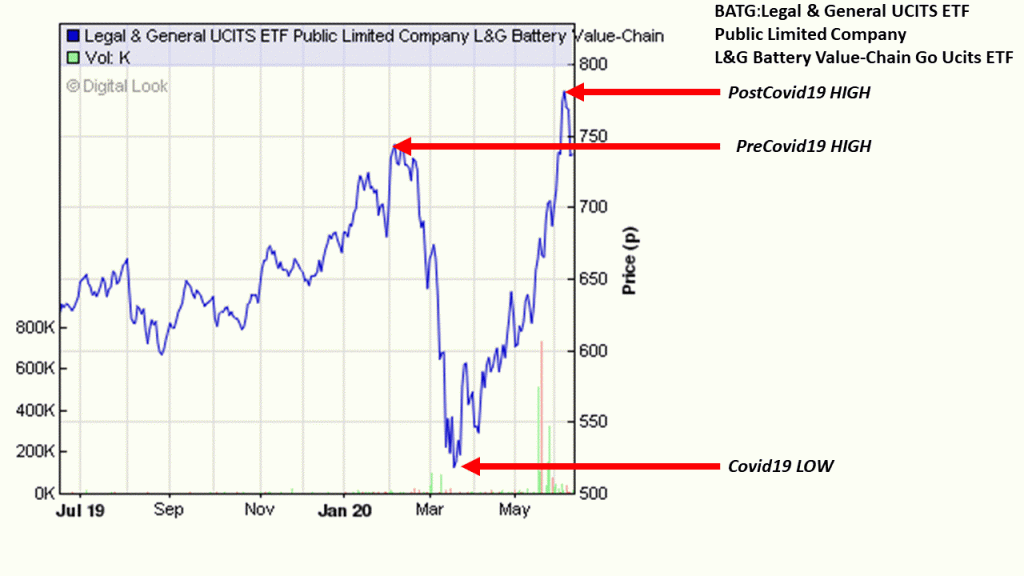
L&G Battery Value-Chain Go Ucits ETF
The performance of the L&G ETF that invests in Lithium Ion technology is very dramatic.
HM Government May 2020 Borrowings
Another month, guess what, take a lucky guess, it is the same old story, HM Government, spends more money than it receives via taxes and duties.
Another deficit month, thus to bridge the gap, needs to borrow on the bond market In May 2020 , the HM Government had to borrow money to meet the difference between tax revenues and public sector expenditure and deal with the economic damage from Covid19. The term for this is The PSNCR: The Public Sector Net Cash Requirement. There were “only” 14 auctions of Gilts (UK Government Bonds) by the UK Debt Management Office to raise cash for HM Treasury:-
28-May-2020 1¼% Treasury Gilt 2027 2,927.5000 Million
28-May-2020 1¾% Treasury Gilt 2049 2,357.7500 Million
27-May-2020 0 1/8% Treasury Gilt 2023 3,750.0000 Million
27-May-2020 1¾% Treasury Gilt 2057 1,785.4990 Million
21-May-2020 0 1/8% Index-linked Treasury Gilt 2028 3 months 1,562.4990 Million
21-May-2020 4¼% Treasury Stock 2032 2,500.0000 Million
20-May-2020 0¾% Treasury Gilt 2023 3,869.6240 Million
14-May-2020 0 5/8% Treasury Gilt 2025 3,250.0000 Million
14-May-2020 1¼ % Treasury Gilt 2041 2,250.0000 Million
13-May-2020 0 1/8% Index-linked Treasury Gilt 2048 3 months 745.8500 Million
06-May-2020 0 1/8% Treasury Gilt 2023 3,897.9580 Million
06-May-2020 1 5/8% Treasury Gilt 2054 1,750.0000 Million
05-May-2020 1 5/8% Treasury Gilt 2028 3,000.0000 Million
05-May-2020 2% Treasury Gilt 2025 4,062.4990 Million
When you add the cash raised:-
£2,927.5000 Million + £2,357.7500 Million + £3,750.0000 Million + £1,785.4990 Million + £1,562.4990 Million + £2,500.0000 Million + £3,869.6240 Million + £3,250.0000 Million + £2,250.0000 Million + £745.8500 Million + £3,897.9580 Million + £1,750.0000 Million + £3,000.0000 Million + £4,062.4990 Million
= £37709.18 Million = £37.70918 Billion
On another way of looking at it, is in the 31 days in May 2020, HM Government borrowed:- £1,216.425129 Million each day for the 31 days.
We are fortunate, while the global banking and financial markets still has the confidence in HM Government to buy the Gilts (Lend money to the UK), the budget deficit keeps rising. What is also alarming, is the dates these bond mature from 2023 through to 2054. All long term borrowings, we are mortgaging our futures, but at least “We Are In It Together….”
BP’s June 2020 Dividend.
Today, BP one of the world’s largest oil company, pays out its quarterly dividend.
$0.105 (8.3421p) a share
The total number of voting rights in BP p.l.c. is 20,265,294,069
https://www.londonstockexchange.com/news-article/BP./total-voting-rights/14559000
Thus:
20,265,294,069 x £0.083421 = £1,690,551,096.530049
That is £1.690 Billion
http://www.shareshop.hsbc.co.uk/shareshop/security.cgi?csi=10022&action=
9.4% yield.
The Investment in Spring 1 (Vivaldi)
The Gresham House Energy Storage Fund
On Friday 12th June, GRID [Gresham House Energy Storage Fund] paid out its June dividend.
1.75p a share
The total number of voting rights of the Company is 234,270,650
https://www.londonstockexchange.com/news-article/GRID/total-voting-rights/14483969
Thus:
234,270,650 x £0.0175 = 4,099,736.375
That is £4m of cash
4.1% yield
Why Buy An Index Fund ?……….
The Investment of RAT
The Art of Investment
Covid19
Unilever PLC June Dividend.
On Thursday 4th June, Unilever PLC paid out its June dividend.
36.14p a share.
https://otp.tools.investis.com/clients/uk/unilever/rns1/regulatory-story.aspx?cid=129&newsid=1259667
Unilever PLC’s issued share capital as at 30 April 2019 consisted of 1,168,530,650 ordinary shares of 3 1/9p each. Unilever PLC does not hold any ordinary shares of 3 1/9p each as treasury shares. Accordingly, there are 1,168,530,650 shares with voting rights.
Thus:
1,168,530,650 x £0.3614 = £422,306,976.91
That is £422 million
http://www.shareshop.hsbc.co.uk/shareshop/security.cgi?csi=10094&action=
4.8% yield.
Legal and General June 2020 Dividend
Tomorrow, the UK’s largest money manager pays out is full year dividend.
12.64p a share
https://www.londonstockexchange.com/exchange/news/market-news/market-news-detail/LGEN/14526159.html
The total number of voting rights in the Company is 5,965,563,767:-
Thus:-
5,965,563,767 x 12.64p = £754,047,260.1488
That is £754 million
http://www.shareshop.hsbc.co.uk/shareshop/security.cgi?csi=10055&action=
That is a 9.1% yield.
Sir John Templeton: Great Quote
The time of maximum pessimism is the best time to buy, and the time of maximum optimism is the best time to sell.” – Sir John Templeton
Investment in Deception: Dominic Cummings
Greencoat UK Wind: May 2020 Dividend
Today, Greencoat UK Wind pays out its May 2020 Dividend.
https://www.greencoat-ukwind.com/
The dividend is 1.775p a share:
https://www.londonstockexchange.com/exchange/news/market-news/market-news-detail/UKW/14525219.html
The total voting rights figure will be 1,518,162,889
Thus:-
1,518,162,889 x 1.775p = £26,947,391.27975
That is £26m.
http://www.shareshop.hsbc.co.uk/shareshop/security.cgi?csi=7013076&action=
5.1% yield.
The Investment of Stevie Nicks
Jlen Environmental Assets Group Limited
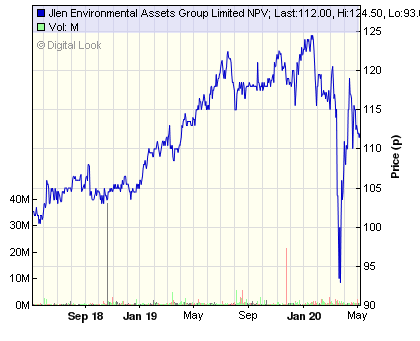
You can see the 2 year trajectory of JLEN
http://www.shareshop.hsbc.co.uk/shareshop/security.cgi?csi=28067217&action=
UK Gilt Auction: Negative Rates.
The UK Government, HM Treasury is borrowing money to fund its day to day operations as tax revenues (income) are lower than government expenditure. Now with the Covid19 pandemic, HM Government is tapping the bond market to borrow money by issuing Gilts.
The British Government sold a government bond with a negative yield for the first time.
On Wed 20th May 2020, the British Government borrowed £3,869.6240 Million (£3.869624 Billion).
The Yield at Auction Price was -0.003%
That means at the end of the 12 months, the Gilt owner would have had their oringial capital reduced by 0.003%.
It is a 3 year gilt.
Thus:-
£3,869.6240 Million on the 20th May 2020:
Capital reduced by 0.003% after year 1 = £3869.507911 Million
Capital reduced by 0.003% after year 2 = £3869.391826 Million
Capital reduced by 0.003% after year 3 = £3869.275744 Million
So after 3 years years the initial capital of £3,869.6240 Million becomes £3869.275744 Million.
A capital reduction of 0.348256 Million = £348,256.
In effect, negative yield effectively means investors have to pay to lend money to fund the government’s response to the Covid-19 pandemic. In searching for a safe haven for their money they bought gilts knowing they would get back less than they paid for them when the bonds mature in three years’ time, because it Trusts the UK Government
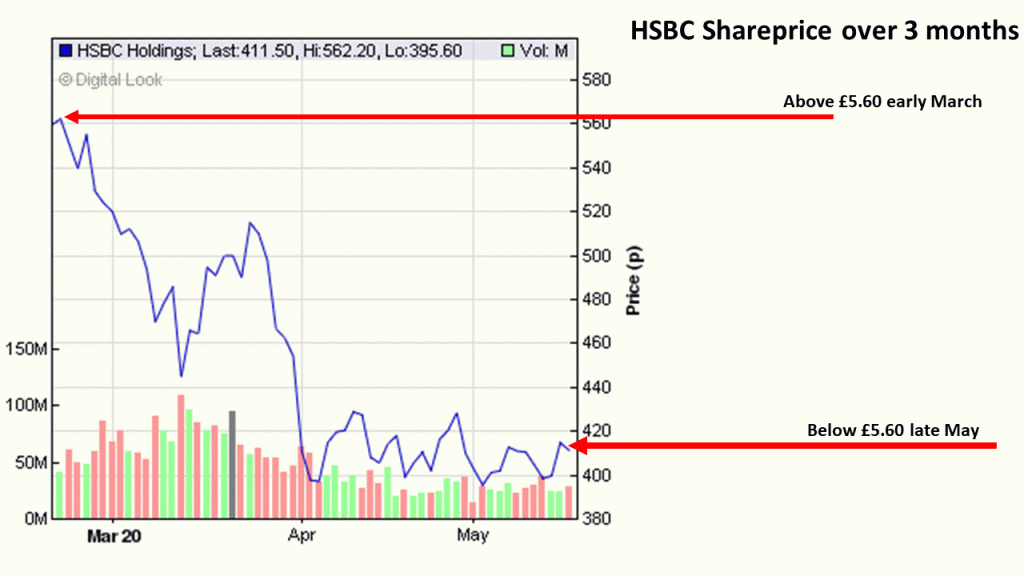
HSBC Shareprice: Covid19
http://www.shareshop.hsbc.co.uk/shareshop/security.cgi?csi=10048&action=
HSBC is one of the world’s largest banks. It has had a rollercoaster sharerprice:-
Berkshire Hathaway Annual General Meeting 2020
Ray Dalio goes into detail on debt
Bernie Madoff: CNBC American Greet
2008 Financial Crisis
Ten reasons why a ‘Greater Depression’ for the 2020s is inevitable:- Nouriel Roubini
Ominous and risky trends were around long before Covid-19, making an L-shaped depression very likely.
After the 2007-09 financial crisis, the imbalances and risks pervading the global economy were exacerbated by policy mistakes. So, rather than address the structural problems that the financial collapse and ensuing recession revealed, governments mostly kicked the can down the road, creating major downside risks that made another crisis inevitable. And now that it has arrived, the risks are growing even more acute. Unfortunately, even if the Greater Recession leads to a lacklustre U-shaped recovery this year, an L-shaped “Greater Depression” will follow later in this decade, owing to 10 ominous and risky trends.
The first trend concerns deficits and their corollary risks: debts and defaults. The policy response to the Covid-19 crisis entails a massive increase in fiscal deficits – on the order of 10% of GDP or more – at a time when public debt levels in many countries were already high, if not unsustainable.
Worse, the loss of income for many households and firms means that private-sector debt levels will become unsustainable, too, potentially leading to mass defaults and bankruptcies. Together with soaring levels of public debt, this all but ensures a more anaemic recovery than the one that followed the Great Recession a decade ago.
A second factor is the demographic timebomb in advanced economies. The Covid-19 crisis shows that much more public spending must be allocated to health systems, and that universal healthcare and other relevant public goods are necessities, not luxuries. Yet, because most developed countries have ageing societies, funding such outlays in the future will make the implicit debts from today’s unfunded healthcare and social security systems even larger.
A third issue is the growing risk of deflation. In addition to causing a deep recession, the crisis is also creating a massive slack in goods (unused machines and capacity) and labour markets (mass unemployment), as well as driving a price collapse in commodities such as oil and industrial metals. That makes debt deflation likely, increasing the risk of insolvency.
A fourth (related) factor will be currency debasement. As central banks try to fight deflation and head off the risk of surging interest rates (following from the massive debt build-up), monetary policies will become even more unconventional and far-reaching. In the short run, governments will need to run monetised fiscal deficits to avoid depression and deflation. Yet, over time, the permanent negative supply shocks from accelerated de-globalisation and renewed protectionism will make stagflation all but inevitable.
A fifth issue is the broader digital disruption of the economy. With millions of people losing their jobs or working and earning less, the income and wealth gaps of the 21st-century economy will widen further. To guard against future supply-chain shocks, companies in advanced economies will re-shore production from low-cost regions to higher-cost domestic markets. But rather than helping workers at home, this trend will accelerate the pace of automation, putting downward pressure on wages and further fanning the flames of populism, nationalism, and xenophobia.
This points to the sixth major factor: deglobalisation. The pandemic is accelerating trends toward balkanisation and fragmentation that were already well underway. The US and China will decouple faster, and most countries will respond by adopting still more protectionist policies to shield domestic firms and workers from global disruptions. The post-pandemic world will be marked by tighter restrictions on the movement of goods, services, capital, labour, technology, data, and information. This is already happening in the pharmaceutical, medical-equipment, and food sectors, where governments are imposing export restrictions and other protectionist measures in response to the crisis.
The backlash against democracy will reinforce this trend. Populist leaders often benefit from economic weakness, mass unemployment, and rising inequality. Under conditions of heightened economic insecurity, there will be a strong impulse to scapegoat foreigners for the crisis. Blue-collar workers and broad cohorts of the middle class will become more susceptible to populist rhetoric, particularly proposals to restrict migration and trade.
This points to an eighth factor: the geostrategic standoff between the US and China. With the Trump administration making every effort to blame China for the pandemic, Chinese President Xi Jinping’s regime will double down on its claim that the US is conspiring to prevent China’s peaceful rise. The Sino-American decoupling in trade, technology, investment, data, and monetary arrangements will intensify.
Worse, this diplomatic breakup will set the stage for a new cold war between the US and its rivals – not just China, but also Russia, Iran, and North Korea. With a US presidential election approaching, there is every reason to expect an upsurge in clandestine cyber warfare, potentially leading even to conventional military clashes. And because technology is the key weapon in the fight for control of the industries of the future and in combating pandemics, the US private tech sector will become increasingly integrated into the national-security-industrial complex.
Internet Investment: Vint Cerf-Our Internet is working. Thank these Cold War-era pioneers who designed it to handle almost anything.
Coronavirus may have forced people to stay at home, but the Internet these scientists envisioned long ago is keeping the world connected
Coronavirus knocked down — at least for a time — Internet pioneer Vinton Cerf, who offers this reflection on the experience: “I don’t recommend it … It’s very debilitating.”
Cerf, 76 and now recovering in his Northern Virginia home, has better news to report about the computer network he and others spent much of their lives creating. Despite some problems, the Internet overall is handling unprecedented surges of demand as it keeps a fractured world connected at a time of global catastrophe.
“This basic architecture is 50 years old, and everyone is online,” Cerf noted in a video interview over Google Hangouts, with a mix of triumph and wonder in his voice. “And the thing is not collapsing.”
The Internet, born as a Pentagon project during the chillier years of the Cold War, has taken such a central role in 21st Century civilian society, culture and business that few pause any longer to appreciate its wonders — except perhaps, as in the past few weeks, when it becomes even more central to our lives.
Many facets of human life — work, school, banking, shopping, flirting, live music, government services, chats with friends, calls to aging parents — have moved online in this era of social distancing, all without breaking the network. It has groaned here and there, as anyone who has struggled through a glitchy video conference knows, but it has not failed.
“Resiliency and redundancy are very much a part of the Internet design,” explained Cerf, whose passion for touting the wonders of computer networking prompted Google in 2005 to name him its “Chief Internet Evangelist,” a title he still holds.
Sign up for our Coronavirus Updates newsletter to track the outbreak. All stories linked in the newsletter are free to access.
Comcast, the nation’s largest source of residential Internet, serving more than 26 million homes, reports peak traffic was up by nearly one third in March, with some areas reaching as high as 60 percent above normal. Demand for online voice, video and VPN connections — all staples of remote work — have surged, and peak usage hours have shifted from evenings, when people typically stream video for entertainment, to daytime work hours.
Concerns about shifting demands prompted European officials to request downgrades in video streaming quality from major services such as Netflix and YouTube, and there have been localized Internet outages and other problems, including the breakage of a key transmission cable running down the West coast of Africa — an incident with no connection to the coronavirus pandemic. Heavier use of home WiFi also has revealed frustrating limits to those networks.
But so far Internet industry officials report they’ve managed the shifting loads and surges. To a substantial extent, the network has managed them automatically because its underlying protocols adapt to shifting conditions, working around trouble spots to find more efficient routes for data transmissions and managing glitches in a way that doesn’t break connections entirely.
Net of Insecurity Part 2: The long life of a quick fix
Some credit goes to Comcast, Google and the other giant, well-resourced corporations essential to the Internet’s operation today. But perhaps even more goes to the seminal engineers and scientists like Cerf, who for decades worked to create a particular kind of global network — open, efficient, resilient and highly interoperable so anyone could join and nobody needed to be in charge.
“They’re deservedly taking a bit of a moment for a high five right now,” said Jason Livingood, a Comcast vice president who has briefed some members of the Internet’s founding generation about how the company has been handling increased demands.
Cerf, along with fellow computer scientist Robert E. Kahn, was a driving force in developing key Internet protocols in the 1970s for the Pentagon’s Defense Advanced Research Projects Agency, which provided early research funding but ultimately relinquished control of the network it spawned. Cerf also was among a gang of self-described “Netheads” who led an insurgency against the dominant forces in telecommunications at the time, dubbed the “Bellheads” for their loyalty to the Bell Telephone Company and its legacy technologies.
Bell, which dominated U.S. telephone service until it was broken up in the 1980s, and similar monopolies in other countries wanted to connect computers through a system much like their lucrative telephone systems, with fixed networks of connections run by central entities that could make all of the major technological decisions, control access and charge whatever the market — or government regulators — would allow.
The vision of the Netheads was comparatively anarchic, relying on technological insights and a lot of faith in collaboration. The result was a network — or really, a network of networks — with no chief executive, no police, no taxman and no laws.
In their place were technical protocols, arrived at through a process for developing expert consensus, that offered anyone access to the digital world from any properly configured device. Their numbers, once measured in the dozens, now rank in the tens of billions, including phones, televisions, cars, dams, drones, satellites, thermometers, garbage cans, refrigerators, watches and so much more.
This Netheads’ idea of a globe-spanning network that no single company or government controlled goes a long way toward explaining why an Indonesian shopkeeper with a phone made in China can log on to an American social network to chat — face to face and almost instantaneously — with her friend in Nigeria. That capability still exists, even as much of the world has banned or restricted international travel.
“You’re seeing a success story right now,” said David D. Clark, a Massachusetts Institute of Technology computer scientist who worked on early Internet protocols, speaking by the videoconferencing service Zoom. “If we didn’t have the Internet, we’d be in an incredibly different place right now. What if this had happened in the 1980s?”
Such a system carries a notable cost in terms of security and privacy, a fact the world rediscovers every time there’s a major data breach, ransomware attack or controversy over the amount of information governments and private companies collect about anyone who’s online — a category that includes more than half of the world’s almost 8 billion people.
Thousands of Zoom video calls left exposed on open Web
But the lack of a central authority is key to why the Internet works as well as it does, especially at times of unforeseen demands.
Some of the early Internet architects — Cerf among them, from his position at the Pentagon — were determined to design a system that could continue operating through almost anything, including a nuclear attack from the Soviets.
That’s one reason the system doesn’t have any preferred path from Point A to Point B. It continuously calculates and recalculates the best route, and if something in the middle fails, the computers that calculate transmission paths find new routes — without having to ask anyone’s permission to do so.
Steve Crocker, a networking pioneer like Cerf, compared this quality to that of a sponge, an organism whose functions are so widely distributed that breaking one part does not typically cause the entire organism to die.
“You can do damage to a portion of it, and the rest of it just lumbers forward,” Crocker said, also speaking by Zoom.
Even more elementally, the Netheads believed in an innovation called “packet-switching,” which broke from the telephone company’s traditional model, called “circuit switching,” that dedicated a line to a single conversation and left it open until the participants hung up.
The Netheads considered that terribly wasteful given that any conversation includes pauses or gaps that could be used to transmit data. Instead, they embraced a model in which all communications were broken into chunks, called packets, that continuously shuttled back and forth over shared lines, without pauses.
The computers at either end of these connections reassembled the packets into whatever they started as — emails, photos, articles or video — but the network itself didn’t know or care what it was carrying. It just moved the packets around and let the recipient devices figure out what to do.
That simplicity, almost an intentional brainlessness at the Internet’s most fundamental level, is a key to its adaptability. As many others have said, it’s a web of highways everyone can use for almost any purpose they desire.
Many of the Internet’s founding generation have memories of trying to convince various Bellheads packet-switching was the inevitable future of telecommunications — cheaper, faster, easier to scale and vastly more efficient and adaptable.
Those anecdotes all end the same way, with the telephone company titans of the day essentially treating the Netheads as precocious but fundamentally misguided children who, some day, might understand how telecommunications technology really worked. Several acknowledged they celebrated just a bit when the telephone companies gradually abandoned old-fashioned circuit-switching for what was called “Voice Over IP” or VoIP. It was essentially transmitting voice calls over the Internet — using the same technical protocols that Cerf and others had developed decades earlier.
Leonard Kleinrock, one of three scientists credited with inventing the concept of packet switching in the 1960s, also was present for the first transmission on the rudimentary network that would, years later, become the Internet.
That was Oct. 29, 1969, and Kleinrock was a computer scientist at the University of California at Los Angeles. A student programmer tried to send the message “login” to a computer more than 300 miles away, at the Stanford Research Institute, but got only as far as the first two letters — “L” and “O” — before the connection crashed.
Retelling the story by phone, over a line using the Internet’s packet-switching technology instead of the one long preferred by the “Bellheads,” he recalled his own experience in trying to convince some phone company executives that he had discovered a technology that would change the world.
“They said, ‘Little boy, go away,’” Kleinrock said. “So we went away.”
And now Kleinrock, 85 and staying home to minimize the risk of catching the coronavirus, is enjoying that his home Internet connection is 2,000 times faster than the phone-booth sized communications device that Internet pioneers used in 1969.
“The network,” he said, “has been able to adapt in a beautiful way.”
The Flu Pandemic @1918
HM Government Borrowing, April 2020
Another month, guess what, take a lucky guess, it is the same old story, HM Government, spends more money than it receives via taxes and duties.
Now we are in a Covid 19 world. UK’s HM Government needs to fund many new demands.
Another deficit month, thus to bridge the gap, needs to borrow on the bond market In March 2020 , the HM Government had to borrow money to meet the difference between tax revenues and public sector expenditure. The term for this is The PSNCR: The Public Sector Net Cash Requirement. There were “only” 17 auctions of Gilts (UK Government Bonds) by the UK Debt Management Office to raise cash for HM Treasury:-
29-Apr-2020 1¾% Treasury Gilt 2049 £2,152.5000 Million
29-Apr-2020 2¾% Treasury Gilt 2024 £3,616.3750 Million
28-Apr-2020 0 1/8% Index-linked Treasury Gilt 2028 3 months £1,499.9990 Million
28-Apr-2020 0 7/8% Treasury Gilt 2029 £3,749.9990 Million
22-Apr-2020 1% Treasury Gilt 2024 £3,671.4760 Million
22-Apr-2020 1¼% Treasury Gilt 2027 £3,141.0000 Million
21-Apr-2020 0 5/8% Treasury Gilt 2025 £4,062.4990 Million
21-Apr-2020 1 5/8% Treasury Gilt 2054 £1,874.9990 Million
16-Apr-2020 1½% Treasury Gilt 2026 £3,648.7500 Million
16-Apr-2020 1¾% Treasury Gilt 2049 £2,499.9980 Million
15-Apr-2020 0 7/8% Treasury Gilt 2029 £3,676.2490 Million
15-Apr-2020 1¾% Treasury Gilt 2037 £2,313.7490 Million
08-Apr-2020 2% Treasury Gilt 2025 £2,750.0000 Million
08-Apr-2020 4¾% Treasury Gilt 2030 £2,092.5000 Million
07-Apr-2020 0 1/8% Treasury Gilt 2023 £4,062.5000 Million
07-Apr-2020 1¾% Treasury Gilt 2057 £1,562.4990 Million
02-Apr-2020 1¼ % Treasury Gilt 2041 £2,299.9970 Million
When you add the cash raised:-
£2,152.50 Million
£3,616.38 Million
£1,500.00 Million
£3,750.00 Million
£3,671.48 Million
£3,141.00 Million
£4,062.50 Million
£1,875.00 Million
£3,648.75 Million
£2,500.00 Million
£3,676.25 Million
£2,313.75 Million
£2,750.00 Million
£2,092.50 Million
£4,062.50 Million
£1,562.50 Million
£2,300.00 Million
Total: £48,675.09 Million = £48.67509 Billion
On another way of looking at it, is in the 30 days in April 2020, HM Government borrowed:- £1622.502967 Million each day for the 30 days.
That is £1.622 Billion A DAY.
We are fortunate, while the global banking and financial markets still has the confidence in HM Government to buy the Gilts (Lend money to the UK), the budget deficit keeps rising. What is also alarming, is the dates these bond mature 2024-2057. All long term borrowings, we are mortgaging our futures, but at least “We Are In It Together….”
The Words of Ray Dalio: Clarity
Words of Investment on Covid 19
Do not obsess about the loss in value of your investments. Do not pontificate that you saw it coming. There is the important difference between wealth and income; stock and flow. The wealth you accumulated over a lifetime in investments has eroded in value as the markets have crashed. But what matters currently is the income, the flow. Do you have a job that offers salary even during the shutdown? Are you confident you will keep the job through and after this period? You are fortunate. Evaluate the reality of the situation………
Bill Gates: Pandemic
CNBC’s full interview with Berkshire Hathaway CEO Warren Buffett [Feb 2020]
HM Government Borrowing, March 2020
Another month, guess what, take a lucky guess, it is the same old story, HM Government, spends more money than it receives via taxes and duties.
Another deficit month, thus to bridge the gap, needs to borrow on the bond market In March 2020 , the HM Government had to borrow money to meet the difference between tax revenues and public sector expenditure. The term for this is The PSNCR: The Public Sector Net Cash Requirement. There were “only” 4 auctions of Gilts (UK Government Bonds) by the UK Debt Management Office to raise cash for HM Treasury:-
19-Mar-2020 0 5/8% Treasury Gilt 2025 £3,250.0000 Million
17-Mar-2020 1¾% Treasury Gilt 2049 £2,299.9990 Million
10-Mar-2020 4¾% Treasury Gilt 2030 £2,587.4880 Million
05-Mar-2020 0 1/8% Index-linked Treasury Gilt 2028 3 months £1,244.2380 Million
04-Mar-2020 0 5/8% Treasury Gilt 2025 £3,500.0000 Million
When you add the cash raised:-
£3,250.0000 Million + £2,299.9990 Million+ £2,587.4880 Million + £1,244.2380 Million + £3,500.0000 Million = £12,764.406 Million
£12,881.725 Million = £12.881725 Billion
On another way of looking at it, is in the 31 days in March 2020, HM Government borrowed:- £415.5395161290323 Million each day for the 31 days.
We are fortunate, while the global banking and financial markets still has the confidence in HM Government to buy the Gilts (Lend money to the UK), the budget deficit keeps rising. What is also alarming, is the dates these bond mature 2025, 2028, 2030 and 2049. All long term borrowings, we are mortgaging our futures, but at least “We Are In It Together….”
What coronavirus means for the global economy | Ray Dalio
Newsnight: Emily is superb
“The disease is not a great leveller, the consequences of which everyone – rich or poor – suffers the same,” the 49-year-old said.
“This is a myth which needs debunking. Those on the front line right now – bus drivers and shelf stackers, nurses, care home workers, hospital staff and shop keepers – are disproportionately the lowest paid members of our workforce. They are more likely to catch the disease because they are more exposed.”
And she added: “Those who live in tower blocks and small flats will find the lockdown a lot tougher. Those who work in manual jobs will be unable to work from home.
Covid 19: The University of Liverpool: Funding for Research
Hello.
The University of Liverpool has a world famous School of Tropical Medicine.
https://www.liverpool.ac.uk/coronavirus/support-us/
They are asking for money to help research into Covid 19 (see the link at the bottom)
It was my first University, and I have made a donation to Liverpool’s world leading research.
If you can help, it would be wonderful.
Thanks
Asad
We are all the same
The WorldCON Fraud.
https://www.youtube.com/watch?v=juebYwvU91o
https://www.youtube.com/watch?v=juebYwvU91o
The episode from American Greed on CNBC.
Copper Destroys Viruses and Bacteria. Why Isn’t It Everywhere?
It could destroy norovirus, MRSA, virulent strains of E. coli, and coronaviruses—including the novel strain currently causing the COVID-19 pandemic.
In 1852, physician Victor Burq visited a copper smelter in Paris’s 3rd arrondissement, where they used heat and chemicals to extract the reddish-brown metal. It was a dirty and dangerous job. Burq found the facility to be “in poor condition,” along with the housing and the hygiene of the smelters. Normally, their mortality rates were “pitiful,” he observed.
Yet, the 200 employees who worked there had all been spared from cholera outbreaks that hit the city in 1832, 1849, and 1852. When Burq learned that 400 to 500 copper workers on the same street had also mysteriously dodged cholera, he concluded that something about their professions—and copper—had made them immune to the highly infectious disease. He launched a detailed investigation into other people who worked with copper, in Paris and cities around the world.
In the 1854 to 1855 cholera epidemic, Burq could not find any deaths of jewellers, goldsmiths, or boilermakers—all those who worked with copper. In people in the army, he found that musicians who played brass instruments (brass is partly copper) were also protected.
In the 1865 Paris epidemic, 6,176 people died of cholera, out of a population of 1,677,000 people—that’s 3.7 people out of every 1,000. But of the 30,000 who worked in different copper industries, only 45 died—an average of around 0.5 per 1,000.
After visiting 400 different businesses and factories in Paris, all of which used copper, and collecting reports from England, Sweden, and Russia on more than 200,000 people, he concluded to the French Academies of Science and Medicine in 1867 that “copper or its alloys, brass and bronze, applied literally and pregnantly to the skin in the cholera epidemic are effective means of prevention which should not be neglected.”
Today, we have insight into why a person handling copper day in and day out would have protection from a bacterial threat: Copper is antimicrobial. It kills bacteria and viruses, sometimes within minutes. In the 19th century, exposure to copper would have been an early version of constantly sanitizing one’s hands.
Since then, studies have shown that copper is able to destroy the microbes that most threaten our lives. It has been shown to kill a long list of microbes, including norovirus, MRSA, a staph bacteria that has become resistant to antibiotics, virulent strains of E. coli that cause food-borne illness, and coronaviruses—possibly including the novel strain currently causing the COVID-19 pandemic.
If copper were more frequently used in hospitals, where 1 in 31 people get healthcare-acquired infections (HAI), or in high-traffic areas, where many people touch surfaces teeming with microbial life—it could play an invaluable role in public health, said Michael Schmidt, a professor of microbiology and immunology at the Medical University of South Carolina, who studies copper. And yet, it is woefully absent from our public spaces, healthcare settings, and homes.
“What happened is our own arrogance and our love of plastic and other materials took over,” Schmidt said of the cheaper products more frequently used. “We moved away from copper beds, copper railings, and copper door knobs to stainless steel, plastic, and aluminum.”
Many of the microbes that make us sick can live on hard surfaces for up to four or five days. When we touch those surfaces, the microbes can make it into our bodies through our nose, mouth, or eyes, and infect us.
On copper surfaces, bacteria and viruses die. When a microbe lands on a copper surface, the copper releases ions, which are electrically charged particles. Those copper ions blast through the outer membranes and destroy the whole cell, including the DNA or RNA inside. Because their DNA and RNA are destroyed, it also means a bacteria or virus can’t mutate and become resistant to the copper, or pass on genes (like for antibiotic resistance) to other microbes.
Before people even knew what bacteria and viruses were, they knew that copper could—somehow—ward off infection. The first recorded medical use of copper is from one of the oldest-known books, the Smith Papyrus, written between 2600 and 2200 B.C. It said that copper was used to sterilize chest wounds and drinking water. Egyptian and Babylonian soldiers would similarly put the shavings from their bronze swords (made from copper and tin) into their open wounds to reduce infections. A more contemporary use of copper: In New York City’s Grand Central Station, the grand staircase is flanked by copper handrails. “Those are actually anti-microbial,” Schmidt said.
The copper smelters were, ostensibly, exposed to less of the cholera bacterium because their surroundings included a lot of copper that bacteria couldn’t live on. That and they potentially were covered in copper particles. If metallurgy doesn’t call to you, there are now some products that are advertised as “copper hand sanitizers,” but they work only if you can expose every surface of your hands to the copper for at least a full minute—essentially transferring any microbes to the copper surface to be killed. It could be difficult to get to every part of your skin’s surface, so having copper surfaces in your environment paired with handwashing would be the ideal combination.
Schmidt said that using copper along with standard hygiene protocols has been shown to reduce bacteria in health care settings by 90 percent. A study from 1983 found that hospital door knobs made of brass, which is part copper, barely had any E. coli growth on them, compared to stainless steel knobs which were “heavily colonized.” This is significant because of how rampant healthcare-acquired infections are: In the U.S. alone, there are about 1.7 million infections and 99,000 deaths linked to HAIs per year, which cost between $35.7 and $45 billion annually, from the extra treatments people need when they get infected.
Microbes that live on surfaces in patient rooms and common spaces in hospitals play a role in getting a HAI—and this is where copper could help. And during this pandemic, when there is serious concern about the spread of the novel coronavirus via contaminated surfaces, a virus-killing substance seems worthwhile indeed.
A study from 2015 found that a different coronavirus, human coronavirus 229E, which causes respiratory tract infections, could still infect a human lung cell after five days of being on materials like teflon, ceramic, glass, silicone rubber, and stainless steel. But on copper alloys, the coronavirus was “rapidly inactivated.”
In a new preprint on SARS-CoV2, the strain that causes COVID-19, researchers at the National Institutes of Health virology laboratory in Montana sprayed the virus onto seven different common materials, reported MIT Technology Review. They found that it survived the longest—up to three days—on plastic and stainless steel, suggesting that surfaces in hospitals or steel poles on public transit could be places where people pick up the illness. Just a single droplet from a cough or sneeze can carry an infectious dose of a virus.
Bill Keevil, a professor of environmental healthcare at the University of Southampton in England who has previously received funding from the Copper Development Association, said that if copper surfaces were put in communal areas where many people gather, it could help reduce the transmission of respiratory viruses, like coronavirus 229E and also SARS-CoV2. Other than hospitals, he thinks the ideal locations for copper are public transportation systems, like buses, airports, subways. But he doesn’t stop there: He would also like to see copper used in sports equipment in gyms, like weights, along with other everyday objects, including shared office supplies, like pens.
In the preprint, SARS-CoV2 “liked copper least,” Antonio Regalado wrote in MIT Technology Review. “The virus was gone after just four hours.”
In 2012, Schmidt and his colleagues ran a clinical trial in three hospitals, Memorial Sloan Kettering Cancer Center in New York City, Medical University of South Carolina, in Charleston, and Ralph H. Johnson Veterans Administration Medical Center, also in Charleston.
First, they figured out which items closest to a patient were the most contaminated with microbes—those were the bed rails, the nurse call button, the arm of the visitor chair, the tray tables, and the IV pole. Enveloping these items in copper reduced the presence of microbes by 83 percent. As a result, HAIs were reduced by 58 percent, even though the researchers had introduced copper to less than 10 percent of the surface area of the room.
We have other methods of killing bacteria and viruses to mitigate HAIs, including ultraviolet light and hydrogen peroxide gas. But both require a hospital room to be empty, and once sick people re-enter rooms, surfaces can easily be contaminated again. “Copper is continuously working 24/7 without supervision, without any need to intervene, and it never runs out,” Schmidt said. “As long as the metal’s there, it’s good to go.”
So given how well it could work, for hospital infections and for health more generally, why isn’t copper everywhere? Why isn’t every door knob, every subway rail, every ICU room, made of copper? Why can we easily buy stainless steel water bottles, but not copper? Where are the copper iPhone cases?
It doesn’t seem like we’ll run out of copper in the near future, according to the World Copper Factbook from 2019. Copper is one of the most recycled of all metals—nearly all copper can be recycled and not lose any of its properties.
Doctors and healthcare workers might not be aware of its properties, as Keevil wrote in The Conversation: “When doctors are asked to name an antimicrobial metal used in healthcare, the most common reply is silver—but little do they know that silver does not work as an antimicrobial surface when dry—moisture needs to be present.”
There might also be a perception that copper is too expensive, Schmidt said, despite the fact that the numbers indicate it would ultimately save money. One of Keevil and Schmidt’s studies from 2015 did the math: The cost of treating an HAI ranges from $28,400 to $33,800 per patient. Installing copper on 10 percent of surfaces cost $52,000 and prevented 14 infections over the course of the 338-day study. If you take the lower end of the HAI treatment cost ($28,400), then those 14 prevented infections saved a total of $397,600, or $1,176 a day.
Even when factoring in how much the copper cost initially, you’d make that money back in savings within two months, Schmidt said. And considering that the copper never loses its microbial killing abilities—hospitals would quickly be saving money (and lives).
“Your payback is literally in less than two [prevented] infections,” he said. “I really struggle with this. Since 2013, I have been literally begging, groveling, pleading, with any and all concerned to make a completely copper encapsulated
[hospital]
bed.”
Advertisement
He recently did convince a company to invest, and said they’re in the process of testing it to show that it could reduce infections even further than 58 percent.
Another reason copper may have been passed over for steel, plastic, or glass is that it can easily tarnish and requires a lot of cleaning to remain shiny. “But copper is antimicrobial regardless of how grody it looks, if it turns green on you, it still has the ability to kill bacteria and viruses and fungi,” he said.
Some places around the world have started to use copper. In Chile, a theme park called Fantasilandia, replaced a lot of its commonly touched surfaces with copper. At the Atlanta airport, 50 water bottle filling stations are now made with copper. But Schmidt believes it should be more widespread.
He said that one of the reasons scientists are worried about the current coronavirus is how infectious it is, and a major way people might be getting it is from touching contaminated surfaces. He thinks it’s possible that the pandemic could raise awareness for copper—if it motivates anyone to start using it. Imagine, he said, if our hospitals and public spaces already had copper in place—it’s impossible to say for sure, but it’s likely that transmission would have been affected.
“I have great confidence that it would work because bacteria or viruses are the ones causing the infection,” hesaid. “If their numbers go down, common sense would tell you: you should have fewer infections.”
Investing in Light
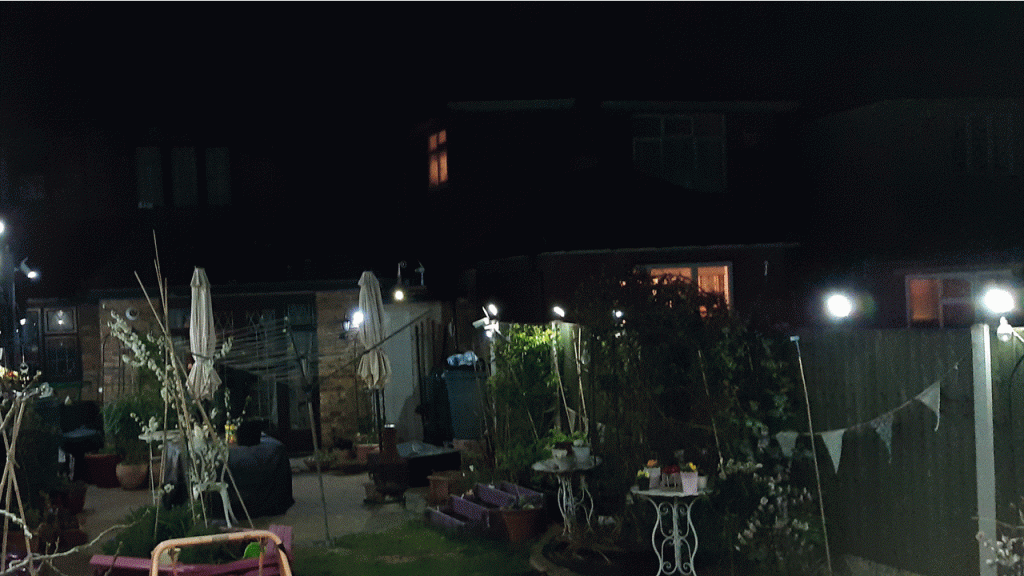
Greencoat UK Wind: Price Drop from Covid 19
The current pandemic crisis over Covid 19 is having major effects on the financial markets.
Take the UK Renewable s company, UK Greencoat Wind.
http://www.shareshop.hsbc.co.uk/shareshop/security.cgi?csi=7013076&action=
It has seen its share price drop from £1.52 to £1.35, but a quick recovery in a sector that is not violently affected by the Covid19 lockdown.
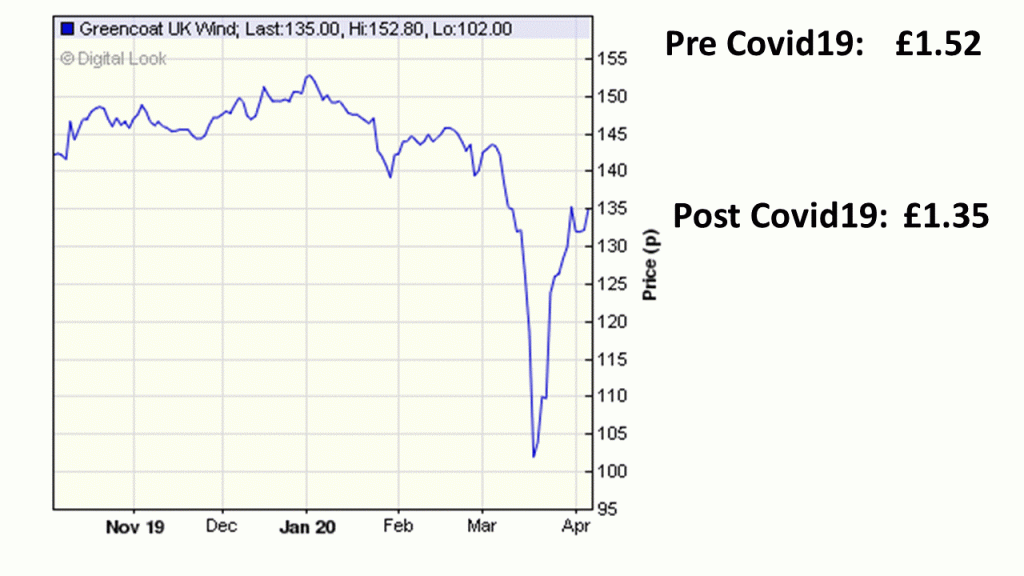
The Two Brilliant Investors

Fighting Covid19
Tip of the iceberg’: is our destruction of nature responsible for Covid-19?
As habitat and biodiversity loss increase globally, the coronavirus outbreak may be just the beginning of mass pandemics
Mayibout 2 is not a healthy place. The 150 or so people who live in the village, which sits on the south bank of the Ivindo River, deep in the great Minkebe Forest in northern Gabon, are used to occasional bouts of diseases such as malaria, dengue, yellow fever and sleeping sickness. Mostly they shrug them off.
But in January 1996, Ebola, a deadly virus then barely known to humans, unexpectedly spilled out of the forest in a wave of small epidemics. The disease killed 21 of 37 villagers who were reported to have been infected, including a number who had carried, skinned, chopped or eaten a chimpanzee from the nearby forest.
I travelled to Mayibout 2 in 2004 to investigate why deadly diseases new to humans were emerging from biodiversity “hotspots” such as tropical rainforests and bushmeat markets in African and Asian cities.
It took a day by canoe and then many hours along degraded forest logging roads, passing Baka villages and a small goldmine, to reach the village. There, I found traumatised people still fearful that the deadly virus, which kills up to 90% of the people it infects, would return.
Villagers told me how children had gone into the forest with dogs that had killed the chimp. They said that everyone who cooked or ate it got a terrible fever within a few hours. Some died immediately, while others were taken down the river to hospital. A few, like Nesto Bematsick, recovered. “We used to love the forest, now we fear it,” he told me. Many of Bematsick’s family members died.
Only a decade or two ago it was widely thought that tropical forests and intact natural environments teeming with exotic wildlife threatened humans by harbouring the viruses and pathogens that lead to new diseases in humans such as Ebola, HIV and dengue.
But a number of researchers today think that it is actually humanity’s destruction of biodiversity that creates the conditions for new viruses and diseases such as Covid-19, the viral disease that emerged in China in December 2019, to arise – with profound health and economic impacts in rich and poor countries alike. In fact, a new discipline, planetary health, is emerging that focuses on the increasingly visible connections between the wellbeing of humans, other living things and entire ecosystems.
Is it possible, then, that it was human activity, such as road building, mining, hunting and logging, that triggered the Ebola epidemics in Mayibout 2 and elsewhere in the 1990s and that is unleashing new terrors today?
“We invade tropical forests and other wild landscapes, which harbour so many species of animals and plants – and within those creatures, so many unknown viruses,” David Quammen, author of Spillover: Animal Infections and the Next Pandemic, recently wrote in the New York Times. “We cut the trees; we kill the animals or cage them and send them to markets. We disrupt ecosystems, and we shake viruses loose from their natural hosts. When that happens, they need a new host. Often, we are it.”
Increasing threat
Research suggests that outbreaks of animal-borne and other infectious diseases such as Ebola, Sars, bird flu and now Covid-19, caused by a novel coronavirus, are on the rise. Pathogens are crossing from animals to humans, and many are able to spread quickly to new places. The US Centers for Disease Control and Prevention (CDC) estimates that three-quarters of new or emerging diseases that infect humans originate in animals.
Some, like rabies and plague, crossed from animals centuries ago. Others, such as Marburg, which is thought to be transmitted by bats, are still rare. A few, like Covid-19, which emerged last year in Wuhan, China, and Mers, which is linked to camels in the Middle East, are new to humans and spreading globally.
Other diseases that have crossed into humans include Lassa fever, which was first identified in 1969 in Nigeria; Nipah from Malaysia; and Sars from China, which killed more than 700 people and travelled to 30 countries in 2002–03. Some, like Zika and West Nile virus, which emerged in Africa, have mutated and become established on other continents.
Kate Jones, chair of ecology and biodiversity at UCL, calls emerging animal-borne infectious diseases an “increasing and very significant threat to global health, security and economies”.
Amplification effect
In 2008, Jones and a team of researchers identified 335 diseases that emerged between 1960 and 2004, at least 60% of which came from animals.
Increasingly, says Jones, these zoonotic diseases are linked to environmental change and human behaviour. The disruption of pristine forests driven by logging, mining, road building through remote places, rapid urbanisation and population growth is bringing people into closer contact with animal species they may never have been near before, she says.
The resulting transmission of disease from wildlife to humans, she says, is now “a hidden cost of human economic development. There are just so many more of us, in every environment. We are going into largely undisturbed places and being exposed more and more. We are creating habitats where viruses are transmitted more easily, and then we are surprised that we have new ones.”
ones studies how changes in land use contribute to the risk. “We are researching how species in degraded habitats are likely to carry more viruses which can infect humans,” she says. “Simpler systems get an amplification effect. Destroy landscapes, and the species you are left with are the ones humans get the diseases from.”
“There are countless pathogens out there continuing to evolve which at some point could pose a threat to humans,” says Eric Fevre, chair of veterinary infectious diseases at the University of Liverpool’s Institute of Infection and Global Health. “The risk [of pathogens jumping from animals to humans] has always been there.”
The difference between now and a few decades ago, Fevre says, is that diseases are likely to spring up in both urban and natural environments. “We have created densely packed populations where alongside us are bats and rodents and birds, pets and other living things. That creates intense interaction and opportunities for things to move from species to species,” he says.
Tip of the iceberg
“Pathogens do not respect species boundaries,” says disease ecologist Thomas Gillespie, an associate professor in Emory University’s department of environmental sciences, who studies how shrinking natural habitats and changing behaviour add to the risk of diseases spilling over from animals to humans.
“I am not at all surprised about the coronavirus outbreak,” he says. “The majority of pathogens are still to be discovered. We are at the very tip of the iceberg.”
Humans, says Gillespie, are creating the conditions for the spread of diseases by reducing the natural barriers between host animals – in which the virus is naturally circulating – and themselves. “We fully expect the arrival of pandemic influenza; we can expect large-scale human mortalities; we can expect other pathogens with other impacts. A disease like Ebola is not easily spread. But something with a mortality rate of Ebola spread by something like measles would be catastrophic,” Gillespie says.
Wildlife everywhere is being put under more stress, he says. “Major landscape changes are causing animals to lose habitats, which means species become crowded together and also come into greater contact with humans. Species that survive change are now moving and mixing with different animals and with humans.”
Gillespie sees this in the US, where suburbs fragment forests and raise the risk of humans contracting Lyme disease. “Altering the ecosystem affects the complex cycle of the Lyme pathogen. People living close by are more likely to get bitten by a tick carrying Lyme bacteria,” he says.
Yet human health research seldom considers the surrounding natural ecosystems, says Richard Ostfeld, distinguished senior scientist at the Cary Institute of Ecosystem Studies in Millbrook, New York. He and others are developing the emerging discipline of planetary health, which looks at the links between human and ecosystem health.
“There’s misapprehension among scientists and the public that natural ecosystems are the source of threats to ourselves. It’s a mistake. Nature poses threats, it is true, but it’s human activities that do the real damage. The health risks in a natural environment can be made much worse when we interfere with it,” he says.
Ostfeld points to rats and bats, which are strongly linked with the direct and indirect spread of zoonotic diseases. “Rodents and some bats thrive when we disrupt natural habitats. They are the most likely to promote transmissions [of pathogens]. The more we disturb the forests and habitats the more danger we are in,” he says.
Felicia Keesing, professor of biology at Bard College, New York, studies how environmental changes influence the probability that humans will be exposed to infectious diseases. “When we erode biodiversity, we see a proliferation of the species most likely to transmit new diseases to us, but there’s also good evidence that those same species are the best hosts for existing diseases,” she wrote in an email to Ensia, the nonprofit media outlet that reports on our changing planet.
The market connection
Disease ecologists argue that viruses and other pathogens are also likely to move from animals to humans in the many informal markets that have sprung up to provide fresh meat to fast-growing urban populations around the world. Here, animals are slaughtered, cut up and sold on the spot.
The “wet market” (one that sells fresh produce and meat) in Wuhan, thought by the Chinese government to be the starting point of the current Covid-19 pandemic, was known to sell numerous wild animals, including live wolf pups, salamanders, crocodiles, scorpions, rats, squirrels, foxes, civets and turtles.
Equally, urban markets in west and central Africa sell monkeys, bats, rats, and dozens of species of bird, mammal, insect and rodent slaughtered and sold close to open refuse dumps and with no drainage.
“Wet markets make a perfect storm for cross-species transmission of pathogens,” says Gillespie. “Whenever you have novel interactions with a range of species in one place, whether that is in a natural environment like a forest or a wet market, you can have a spillover event.”
The Wuhan market, along with others that sell live animals, has been shut by the Chinese authorities, and last month Beijing outlawed the trading and eating of wild animals except for fish and seafood. But bans on live animals being sold in urban areas or informal markets are not the answer, say some scientists.
“The wet market in Lagos is notorious. It’s like a nuclear bomb waiting to happen. But it’s not fair to demonise places which do not have fridges. These traditional markets provide much of the food for Africa and Asia,” says Jones.
“These markets are essential sources of food for hundreds of millions of poor people, and getting rid of them is impossible,” says Delia Grace, a senior epidemiologist and veterinarian with the International Livestock Research Institute, which is based in Nairobi, Kenya. She argues that bans force traders underground, where they may pay less attention to hygiene.
evre and colleague Cecilia Tacoli, principal researcher in the human settlements research group at the International Institute of Environment and Development (IIED), argue in a blog post that rather than pointing the finger at wet markets, we should look at the burgeoning trade in wild animals.
“It is wild animals rather than farmed animals that are the natural hosts of many viruses,” they write. “Wet markets are considered part of the informal food trade that is often blamed for contributing to spreading disease. But … evidence shows the link between informal markets and disease is not always so clear cut.”
Changing behaviour
So what, if anything, can we do about all of this?
Jones says that change must come from both rich and poor societies. Demand for wood, minerals and resources from the global north leads to the degraded landscapes and ecological disruption that drives disease, she says. “We must think about global biosecurity, find the weak points and bolster the provision of health care in developing countries. Otherwise we can expect more of the same,” she adds.
“The risks are greater now. They were always present and have been there for generations. It is our interactions with that risk which must be changed,” says Brian Bird, a research virologist at the University of California, Davis School of Veterinary Medicine One Health Institute, where he leads Ebola-related surveillance activities in Sierra Leone and elsewhere.
“We are in an era now of chronic emergency,” Bird says. “Diseases are more likely to travel further and faster than before, which means we must be faster in our responses. It needs investments, change in human behaviour, and it means we must listen to people at community levels.”
Getting the message about pathogens and disease to hunters, loggers, market traders and consumers is key, Bird says. “These spillovers start with one or two people. The solutions start with education and awareness. We must make people aware things are different now. I have learned from working in Sierra Leone with Ebola-affected people that local communities have the hunger and desire to have information,” he says. “They want to know what to do. They want to learn.”
Fevre and Tacoli advocate rethinking urban infrastructure, particularly within low-income and informal settlements. “Short-term efforts are focused on containing the spread of infection,” they write. “The longer term – given that new infectious diseases will likely continue to spread rapidly into and within cities – calls for an overhaul of current approaches to urban planning and development.”
The bottom line, Bird says, is to be prepared. “We can’t predict where the next pandemic will come from, so we need mitigation plans to take into account the worst possible scenarios,” he says. “The only certain thing is that the next one will certainly come.”
This piece is jointly published with Ensia
BP Quarterly Dividend
On Friday 27th March (last week), BP paid out its quarterly dividend.
8.1558p a share.
https://www.londonstockexchange.com/exchange/news/market-news/market-news-detail/BP./14442748.html
The total number of voting rights in BP p.l.c. is 20,261,183,605
Thus:-
20,261,183,605 x £0.081558 = £1,652,461,612.45659
That is £1,652 Million = £1.652 Billion
6.38% dividend yield.
HM Government Borrowing, February 2020
Another month, guess what, take a lucky guess, it is the same old story, HM Government, spends more money than it receives via taxes and duties.
Another deficit month, thus to bridge the gap, needs to borrow on the bond market In Feb 2020 , the HM Government had to borrow money to meet the difference between tax revenues and public sector expenditure. The term for this is The PSNCR: The Public Sector Net Cash Requirement. There were “only” 3 auctions of Gilts (UK Government Bonds) by the UK Debt Management Office to raise cash for HM Treasury:-
04-Feb-2020 0 1/8% Index-linked Treasury Gilt 2036 3 months £800.0000 Million
20-Feb-2020 1½% Treasury Gilt 2026 £3,269.8750 Million
25-Feb-2020 0 7/8% Treasury Gilt 2029 £3,441.9750 Million
When you add the cash raised:-
£800.0000 Million + £3,269.8750 Million + £3,441.9750 Million = £7,511.85 Million
£7,511.85 Million = £7.51185 Billion
On another way of looking at it, is in the 29 days in Feb 2020, HM Government borrowed:- £259.0293103448276 Million each day for the 29 days.
We are fortunate, while the global banking and financial markets still has the confidence in HM Government to buy the Gilts (Lend money to the UK), the budget deficit keeps rising. What is also alarming, is the dates these bond mature 2026, 2029 and 2036. All long term borrowings, we are mortgaging our futures, but at least “We Are In It Together….”
About Covid19
https://www.medrxiv.org/content/10.1101/2020.03.09.20033217v2.full.pdf
Key points:-
HCoV-19…
– remained viable in aerosols throughout the duration of [the] experiment
(3 hours).
– was most stable on plastic and stainless steel and viable virus could
be detected up to 72 hours post application.
– No viable virus could be measured after 4 hours on copper or after
24 hours on cardboard.
So it *does* appear to hang around in the air, and can last up to 3
days on plastic surfaces. I was surprised with the cardboard result.
None of this is to say that these are the main methods of current
transmission, but they are interesting nevertheless
Bank of England response to Covid19
£200bn
https://www.bankofengland.co.uk/markets/market-notices/2020/apf-asset-purchases-and-tfsme-march-2020
Over recent days, and in common with a number of other advanced economy bond markets, conditions in the UK gilt market have deteriorated as investors have sought shorter-dated instruments that are closer substitutes for highly liquid central bank reserves. As a consequence, UK and global financial conditions have tightened.
At its special meeting on 19 March, the MPC judged that a further package of measures was warranted to meet its statutory objectives. It therefore voted unanimously to increase the Bank of England’s holdings of UK government bonds and sterling non-financial investment-grade corporate bonds by £200 billion to a total of £645 billion, financed by the issuance of central bank reserves; and to reduce Bank Rate by 15 basis points to 0.1%. The Committee also voted unanimously that the Bank of England should enlarge the Term Funding Scheme with additional incentives for SMEs (TFSME).
This Market Notice sets out operational details for additional asset purchases and the change of terms relating to the TFSME. Other than as amended by this Market Notice, previous Market Notices relating to the Bank’s gilt purchases, purchases of corporate bonds and TFSME will apply
The US Federal Reserve Response to Covid19
$700bn
https://www.federalreserve.gov/newsevents/pressreleases/monetary20200323b.htm
- Support for critical market functioning. The Federal Open Market Committee (FOMC) will purchase Treasury securities and agency mortgage-backed securities in the amounts needed to support smooth market functioning and effective transmission of monetary policy to broader financial conditions and the economy. The FOMC had previously announced it would purchase at least $500 billion of Treasury securities and at least $200 billion of mortgage-backed securities. In addition, the FOMC will include purchases of agency commercial mortgage-backed securities in its agency mortgage-backed security purchases.
- Supporting the flow of credit to employers, consumers, and businesses by establishing new programs that, taken together, will provide up to $300 billion in new financing. The Department of the Treasury, using the Exchange Stabilization Fund (ESF), will provide $30 billion in equity to these facilities.
- Establishment of two facilities to support credit to large employers – the Primary Market Corporate Credit Facility (PMCCF) for new bond and loan issuance and the Secondary Market Corporate Credit Facility (SMCCF) to provide liquidity for outstanding corporate bonds.
- Establishment of a third facility, the Term Asset-Backed Securities Loan Facility (TALF), to support the flow of credit to consumers and businesses. The TALF will enable the issuance of asset-backed securities (ABS) backed by student loans, auto loans, credit card loans, loans guaranteed by the Small Business Administration (SBA), and certain other assets.
- Facilitating the flow of credit to municipalities by expanding the Money Market Mutual Fund Liquidity Facility (MMLF) to include a wider range of securities, including municipal variable rate demand notes (VRDNs) and bank certificates of deposit.
- Facilitating the flow of credit to municipalities by expanding the Commercial Paper Funding Facility (CPFF) to include high-quality, tax-exempt commercial paper as eligible securities. In addition, the pricing of the facility has been reduced.
Royal Dutch Shell March 2020 Dividend.
Today, Royal Dutch Shell pays out this quarterly dividend.
https://www.londonstockexchange.com/exchange/news/market-news/market-news-detail/RDSA/14451966.html
£0.364 a share.
Now the share capital of Royal Dutch Shell is made up of Shell A and Shell B
Royal Dutch Shell plc’s capital as at 28 February 2020, consists of 4,117,374,078 A shares and 3,723,888,604 B shares, each with equal voting rights. Royal Dutch Shell plc holds no ordinary shares in Treasury.
https://www.londonstockexchange.com/exchange/news/market-news/market-news-detail/RDSA/14442753.html
Thus:
(4,117,374,078 A shares) x £0.364 a share + (3,723,888,604 B shares) x £0.364 a share = 7, 841,262,682 x £0.364 = £2,854,219,616.248
That is £2.854219616.248 Billion
The Balance Sheet of JP Morgan
The USA’s largest bank is JP Morgan.
https://www.jpmorganchase.com/
It has a huge balance sheet:-
https://www.jpmorganchase.com/corporate/investor-relations/document/financial-highlights-2018.pdf
Total Assets $2,622,532 Billion = $2.622 Trillion.
Total Deposits $1,470,666 Billion = $1.470 Trillion
Market capitalisation $319,780 Million = $319 Billion
The Corona Virus
The Foreign and Colonial Investment Trust.
The Foreign and Colonial Investment Trust is the oldest investment trust in the UK.
Its top hold 20 holdings are:
PE Investment Holdings 2018 LP 2.3% of the fund
Amazon 1.9% of the fund
Microsoft 1.6% of the fund
Alphabet 1.5% of the fund
Facebook 1.5% of the fund
Apple 1.1% of the fund
UnitedHealth 0.9% of the fund
Inflexion Strategic Partners LP 0.9% of the fund
Alibaba 0.9% of the fund
JPMorgan Chase 0.8% of the fund
Dollar General 0.8% of the fund
Visa 0.8% of the fund
Mastercard 0.8% of the fund
Comcast 0.7% of the fund
Chevron 0.7% of the fund
Broadcom 0.7% of the fund
Novo Nordisk 0.7% of the fund
AstraZeneca 0.7% of the fund
Anthem 0.7% of the fund
Utilico Emerging Markets 0.6% of the fund
Asset Allocation Is:-
UK equity 7.9% of the fund
Europe ex UK equity 16.2% of the fund
North America equity 54.0% of the fund
Japan equity 8.6% of the fund
Pacific ex Japan equity 1.7% of the fund
Emerging markets equity 11.0% of the fund
Liquidity 0.6% of the fund
Total 100.0% of the fund
Covid 19
Legal and General: Assets:-
Legal and General’s the UK’s largest asset manager, published its financial results. What jumps out are the AUM (Assets Under Management)
LGIM AUM up 18% at £1,196bn
£1,196 Bn = £1.196 TRILLION
https://www.legalandgeneralgroup.com/media-centre/press-releases/full-year-results-2019/
