Global stock markets are under pressure with the collapse and rescue of Silicon Valley Bank.
Silicon Valley Bank: Shares fall as fears persist about failed US bank – BBC News
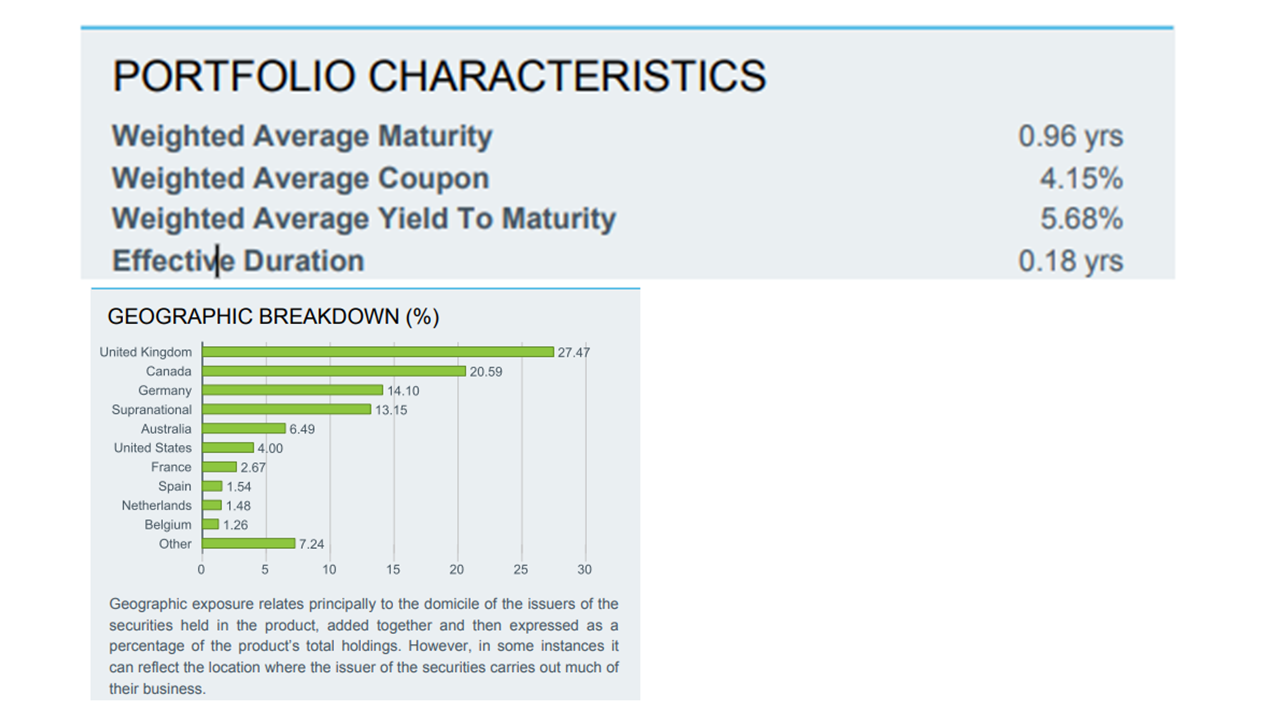
What is interesting, is to see the response from the US Federal Reserve. One thing for sure, is that Silicon Valley Bank, had a huge portolio of US T-Bonds (US Treasuries), and with rising interest rates, the value of these bonds has fallen in value, giving problems to bank, and is exactly what the UK saw with the disastrous mini-budget of Liz Truss and Kwasi Kwateng, that had a huge detrimental effect to UK pension funds, that owned UK Government Bonds (Gilts)
With rising interest rates, a bond that were historically issued paying an interest rate (coupon) of say 0.75%, was worth $100 at issue, could be worth $77 on the open market, when newer bonds issued are paying say 1.9%. So with this drop of 23% ($100 – $77 = $23 loss), the US Federal Reserve is offering to buy that bond trading at $77 for “par” = $100. The Fed is effectively buying the bonds at the issue value = face value. The lender of last resort is the buyer of last resort = The US Fed.
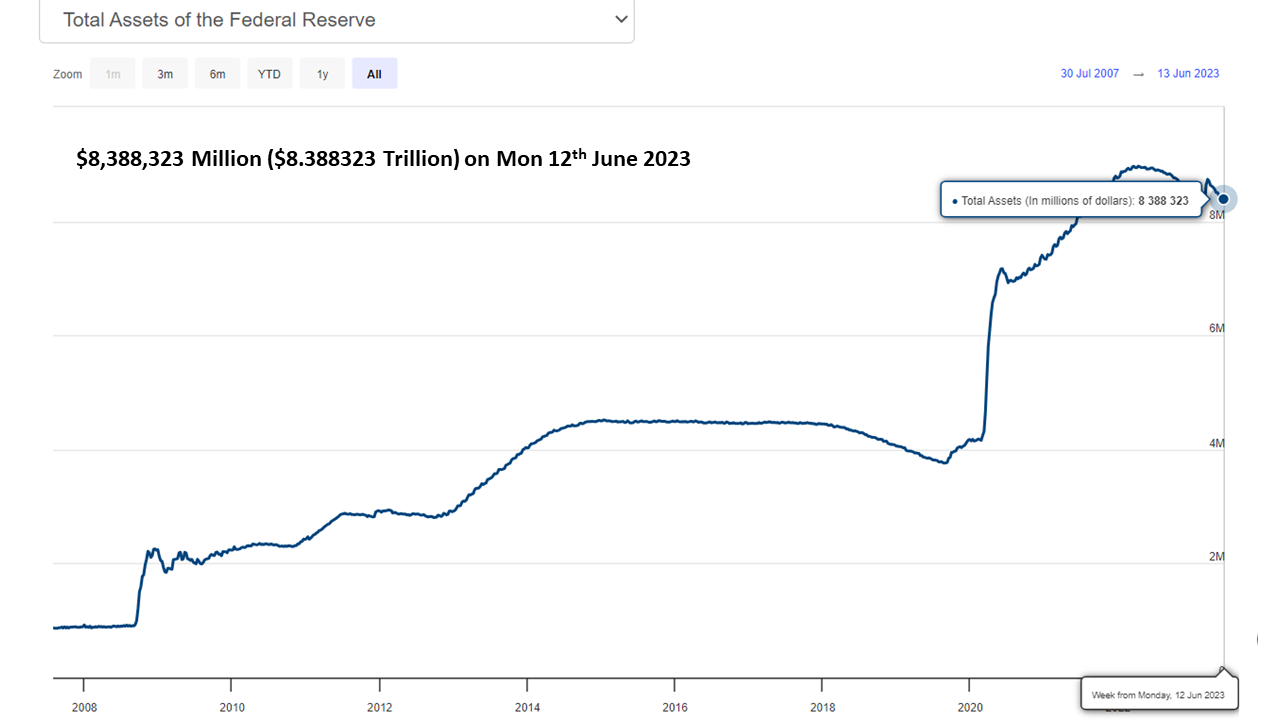
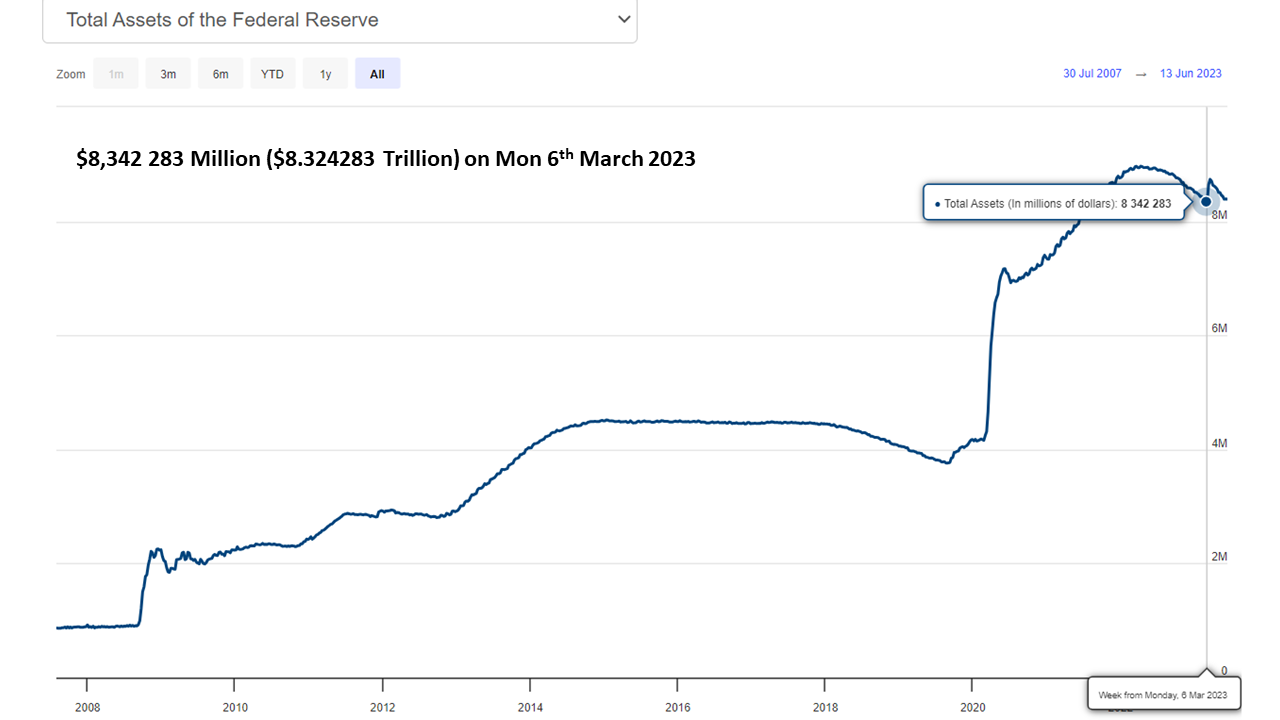
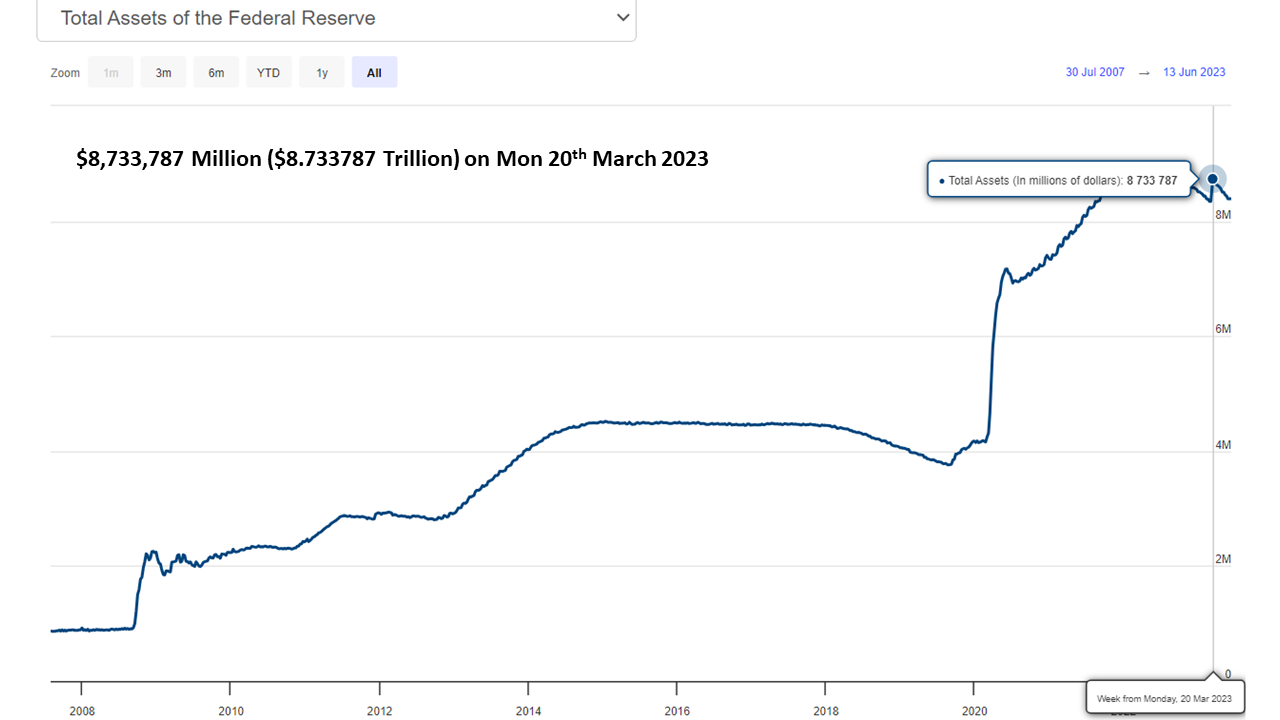
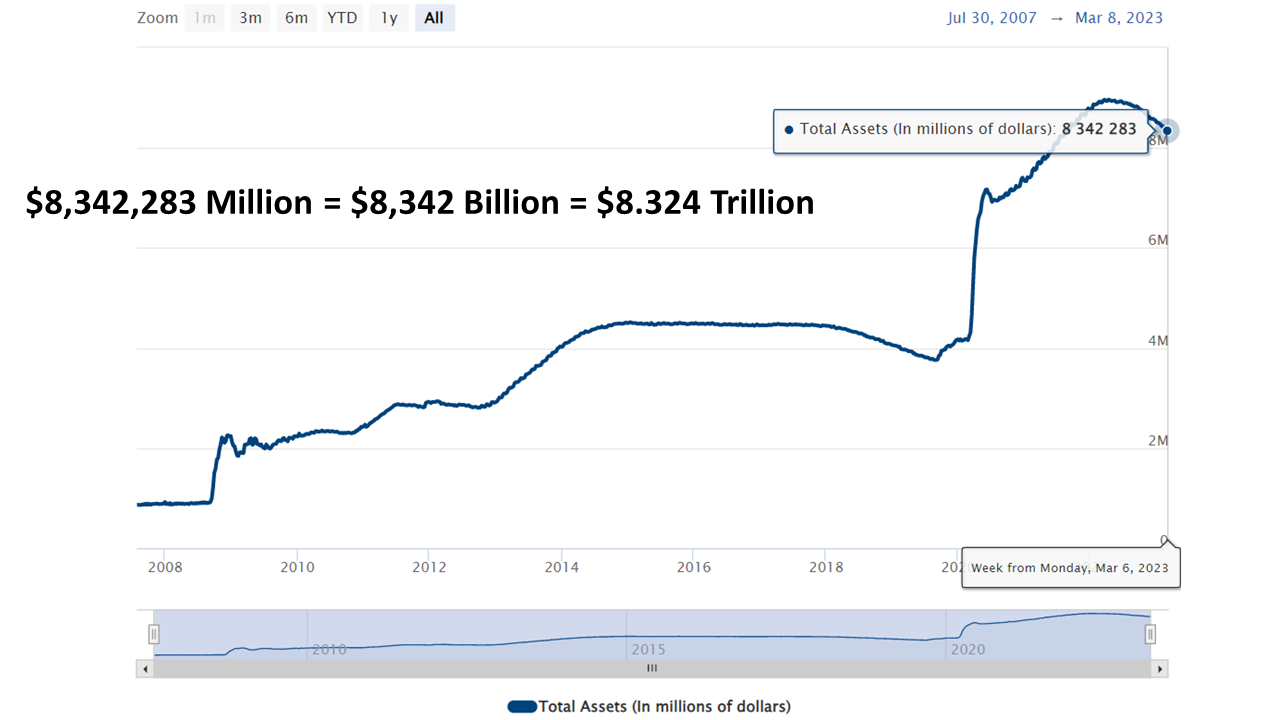
So not a tax payer bailout, but a rescue from the US Federal Reserve, who effectively is using its balance sheet to buy these assets trading at “inflated prices” using its mighty balance sheet (A balance sheet of over $8 Trillion) to theoretically buying an asset that trades today at $77 for $100. “In Fed…We Trust” The Fed’s actions have been very decisive, to ensure smooth market functioning and stability in the financial markets.
Federal Reserve Board – Federal Reserve Board announces it will make available additional funding to eligible depository institutions to help assure banks have the ability to meet the needs of all their depositors
Federal Reserve Board announces it will make available additional funding to eligible depository institutions to help assure banks have the ability to meet the needs of all their depositors :
“To support American businesses and households, the Federal Reserve Board on Sunday announced it will make available additional funding to eligible depository institutions to help assure banks have the ability to meet the needs of all their depositors. This action will bolster the capacity of the banking system to safeguard deposits and ensure the ongoing provision of money and credit to the economy.
The Federal Reserve is prepared to address any liquidity pressures that may arise.
The additional funding will be made available through the creation of a new Bank Term Funding Program (BTFP), offering loans of up to one year in length to banks, savings associations, credit unions, and other eligible depository institutions pledging U.S. Treasuries, agency debt and mortgage-backed securities, and other qualifying assets as collateral. These assets will be valued at par. The BTFP will be an additional source of liquidity against high-quality securities, eliminating an institution’s need to quickly sell those securities in times of stress.
With approval of the Treasury Secretary, the Department of the Treasury will make available up to $25 billion from the Exchange Stabilization Fund as a backstop for the BTFP. The Federal Reserve does not anticipate that it will be necessary to draw on these backstop funds.
After receiving a recommendation from the boards of the Federal Deposit Insurance Corporation (FDIC) and the Federal Reserve, Treasury Secretary Yellen, after consultation with the President, approved actions to enable the FDIC to complete its resolutions of Silicon Valley Bank and Signature Bank in a manner that fully protects all depositors, both insured and uninsured. These actions will reduce stress across the financial system, support financial stability and minimize any impact on businesses, households, taxpayers, and the broader economy.
The Board is carefully monitoring developments in financial markets. The capital and liquidity positions of the U.S. banking system are strong and the U.S. financial system is resilient.
Depository institutions may obtain liquidity against a wide range of collateral through the discount window, which remains open and available. In addition, the discount window will apply the same margins used for the securities eligible for the BTFP, further increasing lendable value at the window.
The Board is closely monitoring conditions across the financial system and is prepared to use its full range of tools to support households and businesses, and will take additional steps as appropriate.”