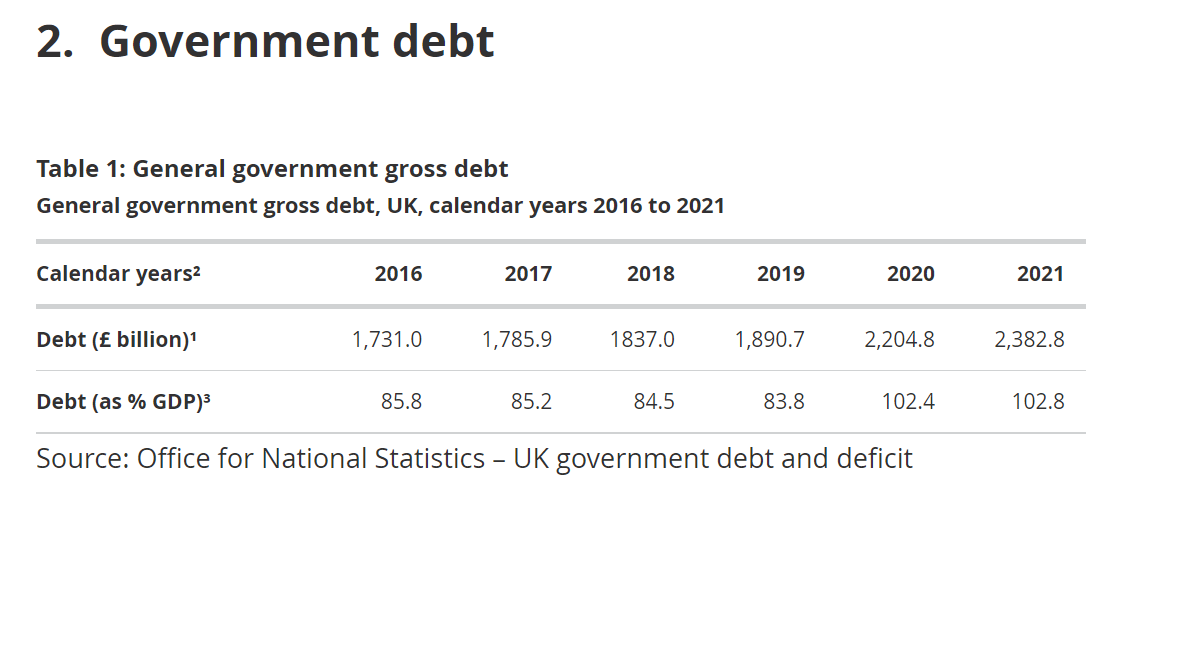
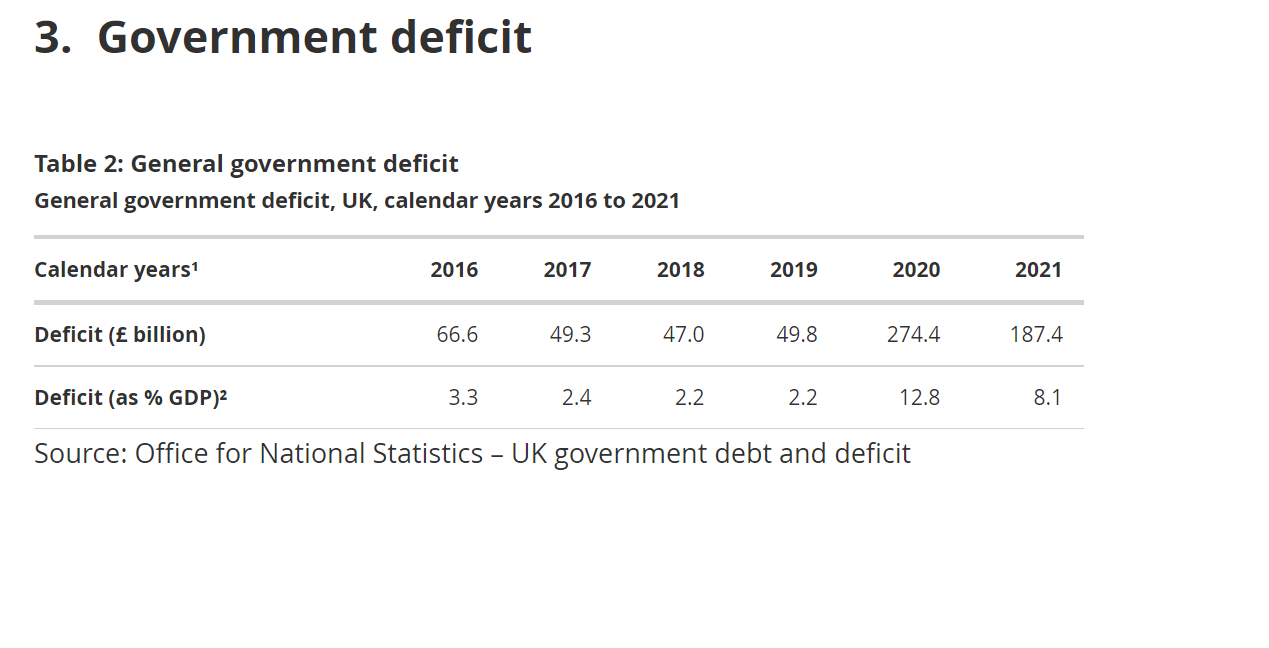
Another month, guess what, take a lucky guess, it is the same old story, HM Government, spends more money than it receives via taxes and duties.
Now we are in a post Covid 19 world. UK’s HM Government needs to fund many new demands. [www.dmo.gov.uk]
https://www.dmo.gov.uk/data/pdfdatareport?reportCode=D2.1PROF7
Another deficit month, thus to bridge the gap, needs to borrow on the bond market In October 2022, the HM Government had to borrow money to meet the difference between tax revenues and public sector expenditure. The term for this is the PSNCR: The Public Sector Net Cash Requirement. There were “only” 8 auctions of Gilts (UK Government Bonds) by the UK Debt Management Office to raise cash for HM Treasury:-
26-Oct-2022 0½% Treasury Gilt 2029 £3,500.0000 Million
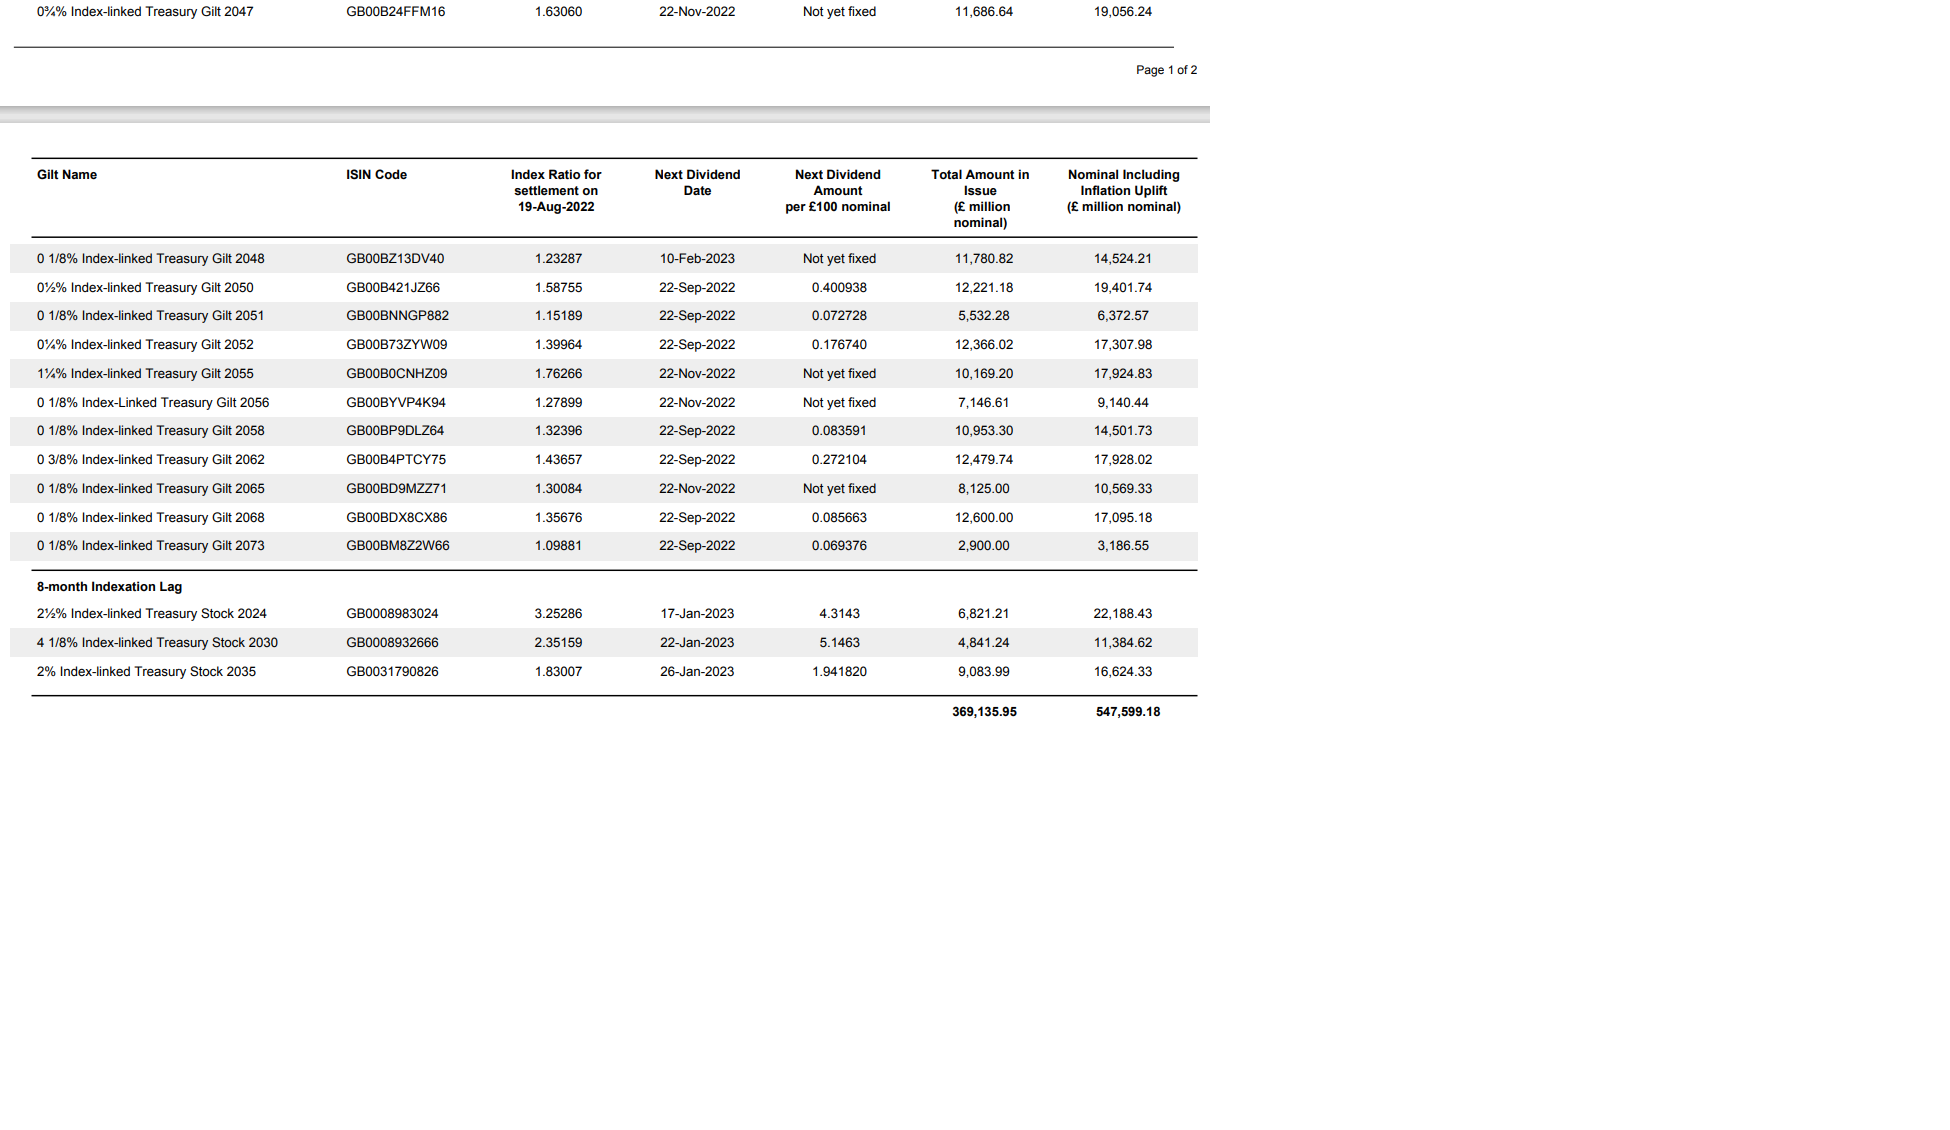
25-Oct-2022 0 1/8% Index-linked Treasury Gilt 2039 3 months £898.8500 Million
19-Oct-2022 1% Treasury Gilt 2032 £4,062.5000 Million
18-Oct-2022 1¼% Treasury Gilt 2051 £3,125.0000 Million
12-Oct-2022 4 1/8% Treasury Gilt 2027 £4,365.2500 Million
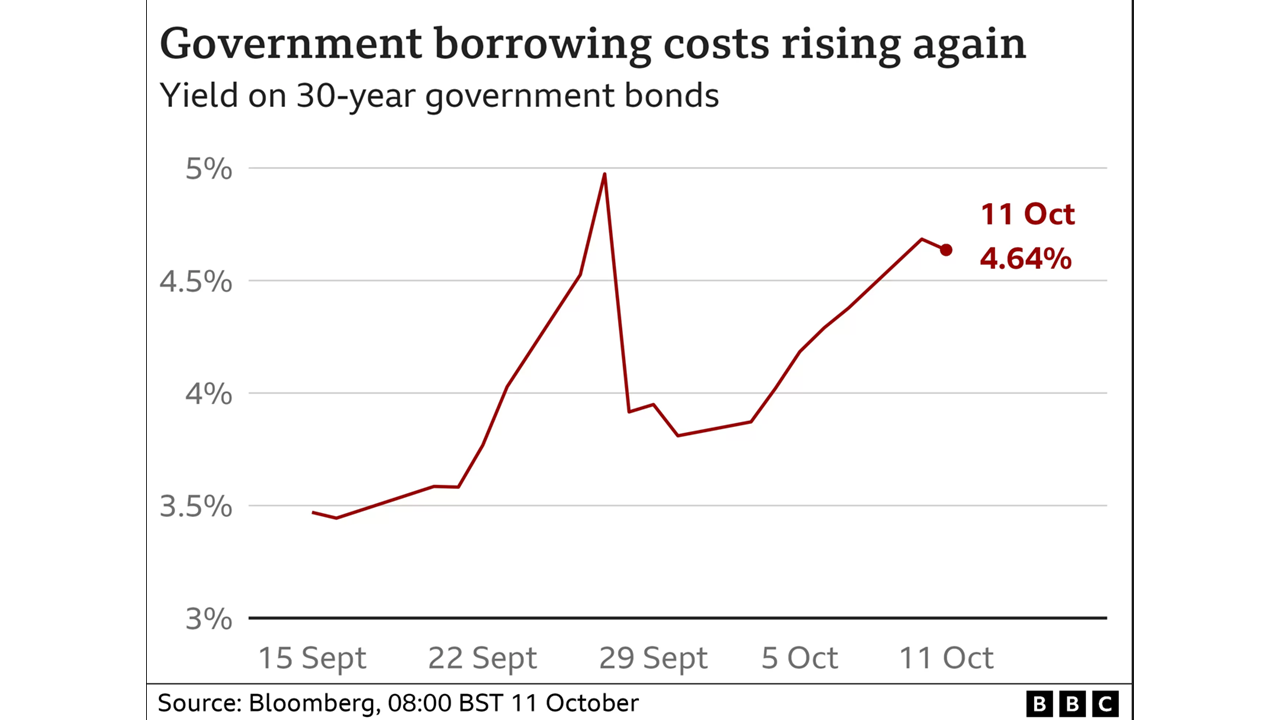
11-Oct-2022 0 1/8% Index-linked Treasury Gilt 2051 3 months £1,106.2990 Million
05-Oct-2022 1% Treasury Gilt 2032 £3,749.9990 Million
04-Oct-2022 0½% Treasury Gilt 2061 £2,500.0000 Million
£3,500.0000 Million + £898.8500 Million + £4,062.5000 Million + £3,125.0000 Million + £4,365.2500 Million + £1,106.2990 Million + £3,749.9990 Million + £2,500.0000 Million = £23,307.898 Million
£23,307.898 Million = £23.307898 Billion
On another way of looking at it, is in the 31 days in October 2022, HM Government borrowed:- £751.86767741935483870967741935484 Million each day for the 31 days.
We are fortunate, while the global banking and financial markets still has the confidence in HM Government to buy the Gilts (Lend money to the UK), the budget deficit keeps rising. What is also alarming, is the dates these bonds maturing from 2027 to 2061. All long-term borrowings, we are mortgaging our futures, but at least “We Are In It Together……”